
Reno-Sparks median sales price pulls back to $600K; YOY home sales down 30%; YOY inventory up 249%!
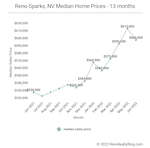
The median home sales price for the Reno, Nevada metro area pulled back to $600,000 in June — taking a breather from the recent parabolic rise in home prices.
June’s median sales price was down 2.4 percent from May’s $615,000 number — but is up 13.2 percent year-over-year.
June’s median sold price per square foot (PPSF) was down 2.9 percent from May’s record-setting sold PPSF. Year-over-year, June’s median was up 12.4 percent.
Homes Sold
446 homes sold in June. This number was down 14.4 percent from the 521 homes sold in May.
Year-over-year, June’s home sales are down 30.4 percent.
Inventory
Available inventory increased 35.2 percent over this time last month. 1,159 homes are currently available for purchase in the Reno-Sparks market — representing just over a 2.6-month supply of inventory.
Year-over-year, overall available inventory is up a remarkable 249.1 percent.
580 homes are presently pending sale in the Reno-Sparks market. That number is down 3.3 percent from May’s 600 pending sales this time last month; and is down 28.7 percent year-over-year.
Days on Market
June’s median days on market (DOM) came in at 42 days — a 3 day increase over May’s median DOM of 39 days. Year-over-year, June’s DOM is unchanged from June 2021’s DOM.
Sales by Type
June sales by type, break out as follows:
- REO sales: 0.0% – unchanged from May’s 0.0%
- Short sales: 0.0% – unchanged from May’s 0.0%
- Subject to Court Approval sales: 0.4% – down from May’s 1.0%
- Relocation sales: 0.0% – down from May’s 1.2%
- Auction sales: 0.0% – unchanged from May’s 0.0%
- Other sales: 0.0% – down from May’s 0.4%
- Equity sales: 99.6% – down from May’s 97.5%
Sales by Price
June sales by price band break out as follows…
| sales price ($000’s) | units sold | % of sales | cumulative % of sales |
| 0 – 99 | 1 | 0.2% | 0.2% |
| 100 – 199 | 0 | 0.0% | 0.2% |
| 200 – 299 | 3 | 0.7% | 0.9% |
| 300 – 399 | 24 | 5.4% | 6.3% |
| 400 – 499 | 83 | 18.6% | 24.9% |
| 500 – 599 | 108 | 24.2% | 49.1% |
| 600 – 699 | 77 | 17.3% | 66.4% |
| 700 – 799 | 43 | 9.6% | 76.0% |
| 800 – 899 | 27 | 6.1% | 82.1% |
| 900 – 999 | 18 | 4.0% | 86.1% |
| 1M – 1.499M | 34 | 7.6% | 93.7% |
| 1.5M – 1.999M | 16 | 3.6% | 97.3% |
| 2.0M+ | 12 | 2.7% | 100% |
| total | 446 | 100% |
June’s median sold price for houses and condos combined was $557,250 — a 2.1 percent decrease from May’s median sold price of $569,420 for combined sales of houses and condos. Year-over-year, June’s combined number is up 14.9 percent.
The table below contains the past 13 months of data[1]…
| Month Year | # Sold | Median Sold Price | Sold Price per Sq Ft | Median DOM | # of Actives | # of Pendings |
| Jun 2022 | 446 | $600,000 | $326.10 | 42 | 1,159 | 580 |
| May 2022 | 521 | $615,000 | $335.74 | 39 | 857 | 600 |
| Apr 2022 | 494 | $595,000 | $329.56 | 43 | 528 | 743 |
| Mar 2022 | 502 | $575,000 | $323.29 | 40 | 310 | 724 |
| Feb 2022 | 377 | $557,000 | $314.28 | 43 | 269 | 738 |
| Jan 2022 | 403 | $569,900 | $300.62 | 56 | 266 | 525 |
| Dec 2021 | 522 | $545,000 | $305.40 | 53 | 282 | 547 |
| Nov 2021 | 544 | $536,500 | $305.41 | 48 | 335 | 748 |
| Oct 2021 | 569 | $540,000 | $308.02 | 47 | 512 | 789 |
| Sep 2021 | 595 | $535,000 | $301.44 | 45 | 538 | 817 |
| Aug 2021 | 562 | $530,000 | $300.94 | 43 | 518 | 820 |
| Jul 2021 | 643 | $525,000 | $288.46 | 42 | 426 | 805 |
| Jun 2021 | 641 | $530,000 | $290.08 | 42 | 332 | 813 |
1. The residential housing market data reported on above covers the cities of Reno, Nevada and Sparks, Nevada [NNRMLS Area #100]. Market data includes SFR (Single Family Residence) properties only. Data excludes Condo/Townhouse, Manufactured/Modular properties. Data courtesy of the Northern Nevada Regional MLS – July 3, 2022. Note: This information is deemed reliable, but not guaranteed.
For historical home sale data dating back to 1998 click here.
Click here to see Reno Homes for Sale.


