
Reno-Sparks median sales price continues its correction — down 4.5% MOM; YOY home sales down 34%; YOY inventory up 212%!
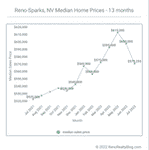
The median home sales price for the Reno, Nevada metro area pulled back to $573,255 in July — a 4.5 percent one-month decrease. The median sales price is now 6.8 percent below the all-time high of $615,000 set in May — and back to levels not seen since March of this year.
July’s median sales price is up 9.2 percent year-over-year.
July’s median sold price per square foot (PPSF) was down 2.1 percent from June’s sold PPSF. Year-over-year, July’s median sold PPSF was up 10.9 percent.
Homes Sold
Home sales continue to decline. 426 homes sold in July. This number was down 7.4 percent from the 460 homes sold in June.
Year-over-year, July’s home sales are down a whopping 33.9 percent.
Inventory
Available inventory increased 14.6 percent over this time last month. 1,328 homes are currently available for purchase in the Reno-Sparks market — representing just over a three-month supply of inventory.
Year-over-year, overall available inventory is up a remarkable 211.7 percent.
549 homes are presently pending sale in the Reno-Sparks market. That number is down 5.3 percent from June’s 580 pending sales this time last month; and is down 31.8 percent year-over-year.
Expect August sales to be lower than July’s sales.
Days on Market
July’s median days on market (DOM) came in at 50 days — a one-week increase over June’s median DOM of 43 days. Year-over-year, July’s DOM is eight days higher than July 2021’s DOM.
Sales by Type
July sales by type, break out as follows:
- REO sales: 0.0% – unchanged from June’s 0.0%
- Short sales: 0.0% – unchanged from June’s 0.0%
- Subject to Court Approval sales: 2.8% – up over June’s 0.4%
- Relocation sales: 0.2% – up over June’s 0.0%
- Auction sales: 0.0% – unchanged from June’s 0.0%
- Other sales: 0.0% – unchanged from June’s 0.0%
- Equity sales: 97.0% – down from June’s 99.6%
Sales by Price
July sales by price band break out as follows…
| sales price ($000’s) | units sold | % of sales | cumulative % of sales |
| 0 – 99 | 0 | 0.0% | 0.0% |
| 100 – 199 | 0 | 0.0% | 0.0% |
| 200 – 299 | 2 | 0.5% | 0.5% |
| 300 – 399 | 26 | 6.1% | 6.6% |
| 400 – 499 | 108 | 25.4% | 32.0% |
| 500 – 599 | 104 | 24.4% | 56.4% |
| 600 – 699 | 72 | 16.9% | 73.3% |
| 700 – 799 | 47 | 11.0% | 84.3% |
| 800 – 899 | 13 | 3.1% | 87.4% |
| 900 – 999 | 16 | 3.8% | 91.2% |
| 1M – 1.499M | 22 | 5.2% | 96.4% |
| 1.5M – 1.999M | 7 | 1.6% | 98.0% |
| 2.0M+ | 9 | 2.1% | 100% |
| total | 426 | 100% |
July’s median sold price for houses and condos combined was $540,000 — a 3.1 percent decrease from June’s median sold price of $557,000 for combined sales of houses and condos. Year-over-year, July’s combined number is up 8.0 percent.
The table below contains the past 13 months of data[1]…
| Month Year | # Sold | Median Sold Price | Sold Price per Sq Ft | Median DOM | # of Actives | # of Pendings |
| Jul 2022 | 426 | $573,255 | $320.04 | 50 | 1,328 | 549 |
| Jun 2022 | 460 | $600,000 | $326.79 | 43 | 1,159 | 580 |
| May 2022 | 520 | $615,000 | $335.63 | 39 | 857 | 600 |
| Apr 2022 | 494 | $595,000 | $329.56 | 43 | 528 | 743 |
| Mar 2022 | 502 | $575,000 | $323.29 | 40 | 310 | 724 |
| Feb 2022 | 377 | $557,000 | $314.28 | 43 | 269 | 738 |
| Jan 2022 | 403 | $569,900 | $300.62 | 56 | 266 | 525 |
| Dec 2021 | 522 | $545,000 | $305.40 | 53 | 282 | 547 |
| Nov 2021 | 544 | $536,500 | $305.41 | 48 | 335 | 748 |
| Oct 2021 | 569 | $540,000 | $308.02 | 47 | 512 | 789 |
| Sep 2021 | 595 | $535,000 | $301.44 | 45 | 538 | 817 |
| Aug 2021 | 562 | $530,000 | $300.94 | 43 | 518 | 820 |
| Jul 2021 | 644 | $525,000 | $288.46 | 42 | 426 | 805 |
1. The residential housing market data reported on above covers the cities of Reno, Nevada and Sparks, Nevada [NNRMLS Area #100]. Market data includes SFR (Single Family Residence) properties only. Data excludes Condo/Townhouse, Manufactured/Modular properties. Data courtesy of the Northern Nevada Regional MLS – August 6, 2022. Note: This information is deemed reliable, but not guaranteed.
For historical home sale data dating back to 1998 click here.
Click here to see Reno Homes for Sale.


Mike McGonagle
August numbers will be interesting to say the least! My numbers have an Incline skew and assume that generally the same percent of homes get double recorded moving into at Trust. They are for the entire County for SFRs build before 2021.
Transactions:
– May 1043
– June 924
– July 859
– August 565 to date, will end up around 705 est.
Median:
– May $600K
– June $640K
– July $570K
– August $565K and will probably skew $5K+ lower.
For fun, take a look at how Nextdoor is doing on their internet buy and flip model! They are currently averaging a $60K+ loss per resale.
Guy Johnson
Hi Mike! Thank you for your comment and the info.
I intend on reporting on August’s numbers today. …both for Reno/Sparks, as well as Incline Village.
[Btw, Did you mean OpenDoor, rather than Nextdoor?]
Joe
I cant take the suspense! September report will be crazy
Guy Johnson
August’s Market Report is out: August 2022 Market Report for Reno and Sparks, Nevada