
Reno-Sparks home sales continue to drop. Pending sales off by 50% Y-o-Y!
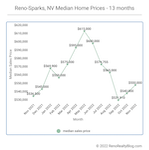
The median home sales price for the Reno, Nevada metro area increased to $550,000 in November — a 1.9 percent month-over-month increase. Year-over-year, November’s median sales price is up 2.5 percent.
Despite the increase in November’s median sales price, interestingly, November’s median sold price per square foot (PPSF) fell 3.0 percent from October’s sold PPSF. Typically, these two metrics (Median sales price and median sold PPSF) move in concert with one another.
November’s divergence between the two could indicate that home buyers are “getting more house for their money”. For example, let’s look at the numbers…
October’s median sold PPSF was $304.17/sq.ft. The median size home sold in October was 1,879 sq.ft. Multplying the two yields $571,535.
November’s median sold PPSF was $294.96/sq.ft. Multiplying by the median size home used above yields $554,230 — or a difference of $17,305 less for the same sized house.
With home sales down over 37 percent year-over-year; and fewer homebuyers shopping at the moment; and homes staying on the market longer; home buyers have greater leverage when negotiating a purchase price. Motivated home sellers may be more willing to make concessions — be it with price, closing costs, or other.
As to why November’s median sales price increased despite these downward pricing pressures, that may be a factor of dwindling inventory at the lower price points — in turn, pushing buyers into larger, and higher-priced homes.
Consider that currently only 37.9 percent of available homes for purchase are price at, or below, the current median sales price of $550,000.
One metric that supports this theory of low inventory pushing buyers into larger homes is the median size of the homes sold for the month. As shown in the calculation above, the median size of homes sold in October was 1,879 sq.ft. Compare that to median size of homes sold in November — 1,971 sq.ft., or a difference of 92 sq.ft. (or 4.9 percent) larger.
Year-over-year, November’s median sold PPSF was down 3.5 percent.
Homes Sold
Home sales fell sharply in November. The 341 homes sold in November represents a 9.5 percent decrease month-over-month; and a whopping 37.3 percent drop year-over-year!
It is true that there is a seasonal component at play (e.g. lower sales typically this time of year), however consider the decrease in sales last year between November and October — 4.6 percent — compared to this year’s decrease of 9.5 percent. This year’s monthly rate of decreasing sales is more than double.
Inventory
Available inventory fell 16.5 percent from this time last month (again, there is seasonality at work here, as many would-be home sellers prefer not to place their homes on the market during the holidays). 1,012 homes are currently available for purchase in the Reno-Sparks market — representing a 3.0 month supply of inventory.
Despite the monthly drop in available inventory, year-over-year, overall available inventory is up a remarkable 202.1 percent.
And, as mentioned above, only 37.9 percent of this inventory are priced at, or below, the current median sales price of $550,000. It will be interesting to see how this impacts December’s median sale price.
376 homes are presently pending sale in the Reno-Sparks market. That number is down 9.0 percent from October’s 412 pending sales this time last month; and is down a whopping 49.9 percent year-over-year! Expect weak December sales.
Days on Market
November’s median days on market (DOM) came in at 73 days — a three day decrease from October’s median DOM of 76 days. Year-over-year, November’s DOM is 25 days higher than November 2021’s DOM.
Sales by Type
November sales by type, break out as follows:
- REO sales: 0.0% – down from October’s 0.3%
- Short sales: 0.0% – unchanged from October’s 0.0%
- Subject to Court Approval sales: 1.5% – down from October’s 2.1%
- Relocation sales: 0.2% – down from October’s 0.5%
- Auction sales: 0.0% – unchanged from October’s 0.0%
- Other sales: 0.0% – down from October’s 0.2%
- Equity sales: 98.2% – up over October’s 96.8%
Sales by Price
November sales by price band break out as follows…
| sales price ($000’s) | units sold | % of sales | cumulative % of sales |
| 0 – 99 | 0 | 0.0% | 0.0% |
| 100 – 199 | 0 | 0.0% | 0.0% |
| 200 – 299 | 7 | 2.1% | 2.1% |
| 300 – 399 | 46 | 13.5% | 15.6% |
| 400 – 499 | 81 | 23.8% | 39.4% |
| 500 – 599 | 76 | 22.3% | 61.7% |
| 600 – 699 | 44 | 12.9% | 74.6% |
| 700 – 799 | 26 | 7.6% | 82.2% |
| 800 – 899 | 13 | 3.8% | 86.0% |
| 900 – 999 | 10 | 2.9% | 88.9% |
| 1M – 1.499M | 21 | 6.2% | 95.1% |
| 1.5M – 1.999M | 9 | 2.6% | 97.7% |
| 2.0M+ | 8 | 2.3% | 100.0% |
| total | 376 | 100% |
November’s median sold price for houses and condos combined was $510,000 — a 1.9 percent decrease from October’s median sold price of $520,000 for combined sales of houses and condos. Year-over-year, November’s combined number is up 2.0 percent.
The table below contains the past 13 months of data[1]…
| Month Year | # Sold | Median Sold Price | Sold Price per Sq Ft | Median DOM | # of Actives | # of Pendings |
| Nov 2022 | 341 | $550,000 | $294.96 | 73 | 1,012 | 376 |
| Oct 2022 | 377 | $540,000 | $304.17 | 76 | 1,212 | 412 |
| Sep 2022 | 476 | $531.910 | $301.34 | 68 | 1,257 | 520 |
| Aug 2022 | 452 | $565,000 | $310.67 | 59 | 1,240 | 613 |
| Jul 2022 | 428 | $574,755 | $320.04 | 50 | 1,328 | 549 |
| Jun 2022 | 461 | $600,000 | $326.70 | 43 | 1,159 | 580 |
| May 2022 | 521 | $615,000 | $335.51 | 39 | 857 | 600 |
| Apr 2022 | 493 | $595,000 | $329.78 | 43 | 528 | 743 |
| Mar 2022 | 502 | $575,000 | $323.29 | 40 | 310 | 724 |
| Feb 2022 | 377 | $557,000 | $314.28 | 43 | 269 | 738 |
| Jan 2022 | 403 | $569,900 | $300.62 | 56 | 266 | 525 |
| Dec 2021 | 522 | $545,000 | $305.40 | 53 | 282 | 547 |
| Nov 2021 | 544 | $536,500 | $305.41 | 48 | 335 | 748 |
1. The residential housing market data reported on above covers the cities of Reno, Nevada and Sparks, Nevada [NNRMLS Area #100]. Market data includes SFR (Single Family Residence) properties only. Data excludes Condo/Townhouse, Manufactured/Modular properties. Data courtesy of the Northern Nevada Regional MLS – December 4, 2022. Note: This information is deemed reliable, but not guaranteed.
For historical home sale data dating back to 1998 click here.
Click here to see Reno Homes for Sale.


C
It’s sloooow for appraisers with limited sales and almost no refi’s.
Bill
Excellent break down of the data. As usual. Thank you Guy.
Guy Johnson
I’m sure it is. Thank you for your comment.
Guy Johnson
My pleasure, Bill.