
Continuing with the trends observed in home sales over the prior three months, December’s home prices similarly exhibited a tale […]
Category: Agent Insights
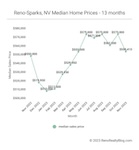
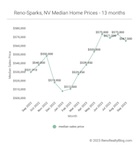
December 2023 Market Report for Reno and Sparks, Nevada
Home sales down sharply; available inventory down sharply; and the median sales price rebounds 2.3% The median home price for […]
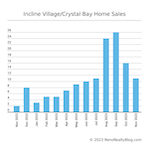
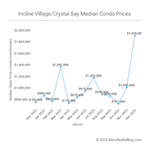
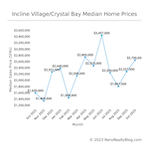
Incline Village / Crystal Bay Housing Market Report – November 2023
Continuing with the trends observed in September and October home sales, November’s numbers similarly exhibited a tale of two markets […]
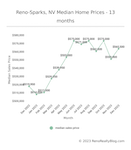
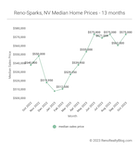
November 2023 Market Report for Reno and Sparks, Nevada
Home sales down sharply; available inventory down sharply; and the median sales price drops 3.4% The median home price for […]
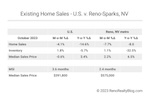
How does the Reno, Nevada housing market compare nationally?
In October 2023, existing-home sales in the U.S. fell by 4.1%, marking a 14.6% drop from the previous year, as […]
Incline Village / Crystal Bay Housing Market Report – October 2023
As was observed with September’s home sales, October’s numbers similarly exhibited a tale of two markets – SFRs (single-family residences) […]
October 2023 Market Report for Reno and Sparks, Nevada
Home prices bounce back to yearly highs in October The median home price for the Reno-Sparks real estate market bounced […]
September 2023 Market Report for Reno and Sparks, Nevada
Home prices and unit sales pull back in September Like the cooling temps of fall, the Reno-Sparks real estate market […]


