
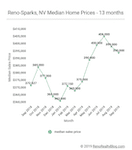
Reno-Sparks median closed sales price continues pull-back
For the second consecutive month the median home sales price in Reno-Sparks, Nevada has declined. September’s median sold home price was $395,000 for the month. That number represents a $4,000, or 1.0 percent, drop from August’s median sales price of $399,000, and a 2.7 percent drop from July’s record-setting median sales price of $406,000.
Despite the pullback for the month. September’s median sale price remains up 6.0 percent, year-over-year.
Interestingly, September’s median sold price per square foot (PPSF) saw an increase for the month. September’s median sold PPSF rose to $219.77/sq.ft. — up 2.8 percent over August’s $213.83/sq.ft.
Year-over-year, September’s median sold PPSF is up 4.3 percent.
Homes Sold
Home sales dropped sharply in September. 558 homes sold in September — representing a 10.0 percent decrease from August’s 620 homes sold.
That being said, year-over-year, September’s number of homes sold was up a whopping 21 percent over the 461 homes sold in September 2018.
Year-to-date home sales for 2019 are now up 1.0 percent compared to the same period last year — 4,713 vs. 4,667, respectively.
Inventory
Currently 1,283 homes are available for purchase in the Reno-Sparks market. This number is down 4.4 percent from the 1,342 homes available for sale this time last month. Year-over-year, current available inventory is down 3.8 percent.
Pending sales fell in September. Presently, 814 homes are pending sale in the Reno-Sparks market. That number is down 9.4 percent from the 898 homes pending sale this time last month. Expect homes sales to continue to decline as the market enters the fall and winter seasons.
Despite its monthly decline, year-over-year, current pending sales are up a healthy 12.3 percent over the number of pending sales this time last year.
Days on Market
September’s median days on market (DOM) came in at 66 days — an increase of 2 days over August’s median DOM.
Year-over-year, September’s DOM number is up 6 days over September 2018’s number.
Sales by Type
September sales by type, break out as follows:
- REO sales: 1.4% – up over August’s 1.3%
- Short sales: 0.2% – up over August’s 0.0%
- Subject to Court Approval sales: 1.3% – down from August’s 1.5%
- Relocation sales: 0.2% – down from August’s 1.2%
- Equity sales: 97.0% – up over August’s 96.0%
Sales by Price
September sales by price band, break out as follows in the table below…
| sales price ($000’s) | units sold | cumulative % of sales |
| 0 – 99 | 0 | 0.0% |
| 100 – 199 | 7 | 1.3% |
| 200 – 299 | 65 | 12.9% |
| 300 – 399 | 219 | 52.2% |
| 400 – 499 | 128 | 75.1% |
| 500 – 599 | 58 | 85.5% |
| 600 – 699 | 28 | 90.5% |
| 700 – 799 | 15 | 93.2% |
| 800 – 899 | 14 | 95.7% |
| 900 – 999 | 6 | 96.8% |
| 1M+ | 18 | 100% |
| total | 558 |
September’s median sold price for houses and condos combined was $368,810 — a slight 0.3 percent decrease from August’s median sold price of $370,000 for combined sales of houses and condos.
The table below contains the past 13 months of data[1]…
| Month Year | # Sold | Median Sold Price | Sold Price per Sq Ft | Median DOM | # of Actives | # of Pendings |
| Sep 2019 | 558 | $395,000 | $219.77 | 66 | 1,283 | 814 |
| Aug 2019 | 620 | $399,000 | $213.83 | 64 | 1,342 | 898 |
| Jul 2019 | 605 | $406,000 | $217.39 | 60 | 1,367 | 906 |
| Jun 2019 | 570 | $400,000 | $219.78 | 55 | 1,252 | 915 |
| May 2019 | 680 | $390,000 | $220.27 | 54 | 1,163 | 911 |
| Apr 2019 | 531 | $375,000 | $213.73 | 65 | 996 | 923 |
| Mar 2019 | 458 | $369,000 | $207.92 | 78 | 867 | 815 |
| Feb 2019 | 362 | $372,150 | $208.84 | 89 | 888 | 774 |
| Jan 2019 | 325 | $362,000 | $210.44 | 86 | 961 | 655 |
| Dec 2018 | 385 | $365,000 | $209.82 | 77 | 1,079 | 541 |
| Nov 2018 | 469 | $377,500 | $211.75 | 71 | 1,237 | 634 |
| Oct 2018 | 468 | $385,000 | $213.86 | 65 | 1,300 | 717 |
| Sep 2018 | 461 | $372,500 | $210.76 | 60 | 1,333 | 725 |
Thank you for taking the time to read this market report. As always, your comments and questions are welcomed.
1. The medians table above is updated on a monthly basis. The median home price data reported covers the cities of Reno, Nevada and Sparks, Nevada [NNRMLS Area #100]. Residential data includes Site/Stick Built properties only. Data excludes Condo/Townhouse, Manufactured/Modular and Shared Ownership properties. Data courtesy of the Northern Nevada Regional MLS – October 4, 2019. Note: This information is deemed reliable, but not guaranteed.
For historical home sale data back to 1998 click here.


