
In this blog post I take a closer look at the magnitude of July’s increase in the median sales price for homes in the Reno-Sparks housing market.
By now most readers of this blog are aware of the huge jump in home prices last month — either through my most recent market report, July median sales price and other market metrics [August 5, 2020], or perhaps from local pieces, such as the Northern Nevada Business Weekly’s Record high in July: Reno’s median home price tops $459K as demand soars [August 14, 2020], or the Reno Gazette-Journal’s Reno median home price hits record $459,900; Sparks tops $400,000 for 1st time [August 11, 2020].
What was the increase?
As I wrote in July’s Market Report (Aug 5, 2020):
July’s median sold home price for Reno-Sparks rocketed to $435,000! Not only was this a whopping 7.4 percent increase over June’s median sales price, but also July’s median sets an all-time record high for our market.
So the median home price for the Reno-Sparks housing market saw a 7.4 percent one month increase. To lend some real numbers to that 7.4 percent increase — the median sales price went from $405,000 in June to $435,000 in July — a whopping $30,000 one-month increase!
Now, I realize a one-month change does not a trend make, but what I am addressing here is simply the sheer magnitude of this one-month increase.
Has such an increase ever occurred before?
Well, yes and no.
Long-time readers of the blog know that I maintain historical housing data for the Reno-Sparks market going back to January 1998. Among other metrics, this data set contains 271 prior months of monthly median sales data.
An analysis of this data reveals that prior to last month there have been seven other instances where the month-over-month percentage change in the median sales price was greater than the 7.4 percent seen in July.
These greatest past instances can be seen in the table below.
The table also includes the equivalent dollar amount that these percentage changes represented. Notice that none of these amounts exceed the $30,000 increase observed in July.
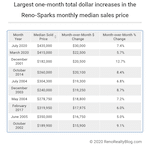
Sorting the historical monthly data by month-over-month dollar amount change yields the following table.
The table above contains the top ten largest dollar amount increases in the monthly medians.
Note that July’s $30,000 was the greatest one-month increase in the median sales price (dollar-wise) going back to the beginning of the data set — January 1998. In fact, July’s $30,000 increase was remarkable 33.3 percent higher than the second greatest one-month increase of $22,500 — which occurred in March of this year.
Was July’s increase unique to Reno-Sparks?
Whether one looks at the percentage increase, or dollar amount increase, July’s median sale price jump was big. But did other markets in Northern Nevada see similar jumps?
The table below shows the change in median sales price for some of the surrounding areas, sorted from highest to lowest. The table also splits out Reno, NV from Sparks, NV for comparison purposes.
Note, that the month-over-month percentage change is for July 2020 over June 2020 only.
As can be seen in the table above, the Gardnerville/Minden market tops the list of other area markets in both month-over-month increase, 21.7 percent; as well as year-over-year increase, 16.8 percent.
Reno, NV came in second on the list with a 10.8 percent month-over-month increase in its median sales price.
All markets shown above exhibit increased median sales prices year-over-year.
How’s does Reno-Sparks compare to what is happening nationally?
From the National Association of REALTORS® Existing Home Sales Report for July (See Existing-Home Sales Continue Record Pace, Soar 24.7% in July):
The median existing-home price for all housing types in July was $304,100, up 8.5% from July 2019 ($280,400), as prices rose in every region. July’s national price increase marks 101 straight months of year-over-year gains. For the first time ever, national median home prices breached the $300,000 level.
Nationally, the median existing-home price for all housing types in June was $295,300. Therefore July’s median of $304,100 represents a 3.0 percent month-over-month increase.
The table below shows Reno-Sparks compared to the U.S.
How is my 2020 Forecast looking?
At the beginning of this year I published a post where I provided a forecast of what level home prices might reach in 2020 (See Reno housing market forecast 2020 [January 9, 2020])
In that blog post I wrote:
…if this methodology is correct, then the Reno-Sparks median sales price should increase to $434,556 by November 2020.
Well, looks like the market hit that number — only a few months early.
Anyone care to guess where the median home price for Reno-Sparks will be at the end of 2020? Please comment below.
As always thank you for reading. Take care of yourself and each other.
The median home price data reported above includes Site/Stick Built properties only. Data excludes Condo/Townhouse, Manufactured/Modular and Shared Ownership properties. Data courtesy of the Northern Nevada Regional MLS – August 24, 2020. Note: This information is deemed reliable, but not guaranteed.


Vale
Intuitively, the almost complete economic shutdown plus an infusion of government money into household budgets healthy enough to be home shopping had a lot to do with this particular jump.
I’m curious about how the composition of in state vs out of state buyers effected the increase in this period and past periods of large month to month increases. I may have to track down some moving company data.
Thank you as always for your analysis Guy.
Guy Johnson
Thank you for your comment, Vale.
Speaking of moving companies, just saw this story today: Movers swamped as home buys spike