
Reno-Sparks’ home prices pull back slightly in September; Homes sold set a record high!
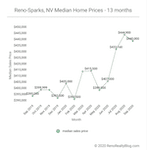
September’s median sold home price for Reno-Sparks fell to $440,000 — a 1.1 percent pullback from August’s record setting $444,900 median sold price.
Year-over-year, September’s median closed sales price was up 11.4 percent.
September’s median sold price per square foot (PPSF) shot up to $240.24/sq.ft. Not only is that number a 5.4 percent increase over August’s sold PPSF of $228.19/sq.ft, but also sets a new record high for sold price per square foot.
Year-over-year, September’s median sold PPSF is up 10.2 percent.
Homes Sold
Home sales were through the roof in September! 678 homes sold for the month – setting an all-time high number of sales for the month of September. [Incidentally, the September with the next highest number of sales occurred in 2016 when 633 homes were sold that month.]
The 678 homes sold in September represents a 3.5 percent increase over the number of homes sold in August — which, itself, also saw an unusually strong number of sales. And, year-over-year, September home sales were up a whopping 17.1 percent!
Year-to-date home sales are now up 1.3 percent from the same period last year. Note, this is the first month this year, since the Coronavirus pandemic’s negative impact on home sales in March and April, that YTD home sales have exceeded the same period for 2019.
Inventory
Currently 432 homes are available for purchase in the Reno-Sparks market. This number is down 7.7 percent from the 468 homes available for sale this time last month.
And year-over-year, current available inventory is down a whopping 46.9 percent!
Pending sales receded in September — mainly due to lack of available inventory. Presently, 1,013 homes are pending sale in the Reno-Sparks market. That number represents a 5.1 percent decrease from the 1,068 homes pending sale this time last month.
However, year-over-year, pending sales are up 24.4 percent. Expect unseasonably high number of sales for the months of October and November.
Days on Market and Days to Contract
September’s median days on market (DOM) fell to just 49 days — a decrease of 5 days from August’s median DOM; and a year-over-year decrease of 19 days from September 2019’s DOM. These numbers show the velocity the current market.
September’s median days to contract (DTC) came in at 5 days — unchanged from August’s median DTC. Year-over-year, September’s DTC number is 8 days lower than September 2019’s 13 DTC.
Sales by Type
September sales by type, break out as follows:
- REO sales: 0.3% – down from August’s 0.5%
- Short sales: 0% – unchanged from August’s 0%
- Subject to Court Approval sales: 1.2% – up over August’s 0.2%
- Relocation sales: 0.6% – unchanged from August’s 0.6%
- Equity sales: 97.9% – down from August’s 98.8%
Sales by Price
September sales by price band break out as follows…
| sales price ($000’s) | units sold | % of sales | cumulative % of sales |
| 0 – 99 | 0 | 0.0% | 0.0% |
| 100 – 199 | 2 | 0.3% | 0.3% |
| 200 – 299 | 29 | 4.3% | 4.6% |
| 300 – 399 | 207 | 30.5% | 35.1% |
| 400 – 499 | 197 | 29.1 | 64.2% |
| 500 – 599 | 104 | 15.3 | 79.5% |
| 600 – 699 | 46 | 6.8% | 86.3% |
| 700 – 799 | 25 | 3.7% | 90.0% |
| 800 – 899 | 17 | 2.5% | 92.5% |
| 900 – 999 | 12 | 1.8% | 94.3% |
| 1M+ | 39 | 5.8% | 100% |
| total | 678 | 100% |
September’s median sold price for houses and condos combined was $420,000 — a 1.2 percent increase over August’s median sold price of $415,000 for combined sales of houses and condos.
The table below contains the past 13 months of data[1]…
| Month Year | # Sold | Median Sold Price | Sold Price per Sq Ft | Median DOM | # of Actives | # of Pendings |
| Sep 2020 | 678 | $440,000 | $240.42 | 49 | 432 | 1,013 |
| Aug 2020 | 655 | $444,900 | $228.19 | 54 | 468 | 1,068 |
| Jul 2020 | 748 | $433,160 | $229.14 | 57 | 588 | 1,037 |
| Jun 2020 | 564 | $407,000 | $222.09 | 58 | 688 | 1,062 |
| May 2020 | 403 | $399,900 | $222.43 | 57 | 720 | 1,048 |
| Apr 2020 | 392 | $415,500 | $219.95 | 51 | 812 | 697 |
| Mar 2020 | 514 | $415,000 | $221.44 | 56 | 774 | 658 |
| Feb 2020 | 459 | $392,500 | $211.63 | 78 | 587 | 816 |
| Jan 2020 | 393 | $405,000 | $216.01 | 88 | 621 | 712 |
| Dec 2019 | 518 | $393,500 | $216.29 | 81 | 779 | 541 |
| Nov 2019 | 455 | $400,000 | $216.54 | 72 | 956 | 683 |
| Oct 2019 | 563 | $399,999 | $216.61 | 76 | 1,090 | 773 |
| Sep 2019 | 579 | $395,000 | $218.24 | 68 | 1,283 | 814 |
Please post your comments and questions below, and thank you for reading this post.
1. The “Past 13 Months of Home Sales Data” table above is updated on a monthly basis. The median home price data reported covers the cities of Reno, Nevada and Sparks, Nevada [NNRMLS Area #100]. Residential data includes Site/Stick Built properties only. Data excludes Condo/Townhouse, Manufactured/Modular and Shared Ownership properties. Data courtesy of the Northern Nevada Regional MLS – October 4, 2020. Note: This information is deemed reliable, but not guaranteed.
For historical home sale data dating back to 1998 click here.
Click here to see Reno Homes for Sale.


