
November home sales set a record high for the month of November. November’s median sales price unchanged from October’s record high. Available inventory drastically low — down 71% Y-o-Y!
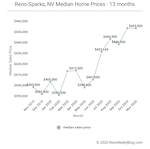
November’s median sold home price for Reno-Sparks held steady at $455,000 — unchanged from October’s record-setting high median sales price.
Year-over-year, November’s median closed sales price was up a whopping 13.8 percent!
November’s median sold price per square foot (PPSF) climbed to $243.82/sq.ft. — a 2.2 percent increase over October’s sold PPSF of $238.58/sq.ft,
Year-over-year, November’s median sold PPSF is up 12.6 percent.
Homes Sold
Home sales continue to exceed year-over-year numbers. 573 homes were sold in November. And although that number was down 8.8 percent from the record-setting number of homes sold in October, year-over-year, November home sales were up a whopping 25.9 percent — setting an all-time high for the number of homes sold in the month of November.
After catching and then surpassing 2019 year-to-date home sales in September 2020, year-to-date home sales are now up 4.8 percent from the same period last year — effectively wiping out the Coronavirus pandemic’s negative impact on home sales observed in March and April of this year. [See What happened on September 21, 2020?]
How long can these record-breaking monthly sales numbers last? Well, read on…
Inventory
Currently there are only 278 homes available for purchase in the Reno-Sparks market. This number is down 27.5 percent from the 385 homes available for sale this time last month.
And year-over-year, current available inventory is down an incredible 70.9 percent! Yes, last year at this time 956 homes were available for purchase — today there are 279!
And the picture becomes even bleaker when one looks at the available inventory of homes priced at, or below, the currently median sales price of $455,000. Currently only 63 homes (22.7 percent) are priced at, or below, the median sales price.
This drastically low amount of inventory has been, and will continue to, negatively impact the number of homes sold. However, that impact has not been readily apparent in monthly home sales totals to date. This is because of the market’s incredibly high absorption rate — which, depending on the formula used to calculate it, currently comes in at 53 – 74 percent. [For context, traditionally, an absorption rate above 20 percent has signaled a seller’s market and an absorption rate below 15 percent is an indicator of a buyer’s market. Our market’s absorption rate is over 50 percent.]
Presently, 797 homes are pending sale in the Reno-Sparks market. Year-over-year, that number is up 16.7 percent over the number of pending sales this time last year. Given that increase, December sales may exceed December 2019 home sales; however, January may tell a different story.
Days on Market and Days to Contract
November’s median days on market (DOM) came in at 52 days — an increase of 2 days over October’s median DOM. However, year-over-year November’s DOM is a whopping 20 days (or 27.7 percent) lower than November 2019’s DOM. These numbers show the velocity the current market.
November’s median days to contract (DTC) came in at 5 days — unchanged from October’s median DTC. Year-over-year, November’s DTC number is 12 days lower than November 2019’s 17 DTC — again, reflecting the velocity the current market.
Sales by Type
November sales by type, break out as follows:
- REO sales: 0.9% – up over October’s 0.2%
- Short sales: 0% – down from October’s 0.2%
- Subject to Court Approval sales: 0.5% – down from October’s 0.7%
- Relocation sales: 0% – down from October’s 0.7%
- Equity sales: 98.6% – up over October’s 98.3%
Sales by Price
November sales by price band break out as follows…
| sales price ($000’s) | units sold | % of sales | cumulative % of sales |
| 0 – 99 | 0 | 0.0% | 0.0% |
| 100 – 199 | 2 | 0.3% | 0.3% |
| 200 – 299 | 24 | 4.2% | 4.5% |
| 300 – 399 | 162 | 28.3% | 32.8% |
| 400 – 499 | 152 | 26.5% | 59.3% |
| 500 – 599 | 87 | 15.2% | 74.5% |
| 600 – 699 | 45 | 7.9% | 82.4% |
| 700 – 799 | 31 | 5.4% | 87.8% |
| 800 – 899 | 17 | 3.0% | 90.8% |
| 900 – 999 | 12 | 2.1% | 92.8% |
| 1M+ | 41 | 7.2% | 100% |
| total | 573 | 100% |
November’s median sold price for houses and condos combined was $430,000 — a 2.4 percent increase over October’s median sold price of $420,000 for combined sales of houses and condos, and an 15.6 percent year-over-year increase.
The table below contains the past 13 months of data[1]…
| Month Year | # Sold | Median Sold Price | Sold Price per Sq Ft | Median DOM | # of Actives | # of Pendings |
| Nov 2020 | 573 | $455,000 | $243.82 | 52 | 278 | 797 |
| Oct 2020 | 628 | $455,000 | $238.58 | 50 | 385 | 979 |
| Sep 2020 | 692 | $440,000 | $239.97 | 49 | 432 | 1,013 |
| Aug 2020 | 656 | $444,900 | $228.25 | 54 | 468 | 1,068 |
| Jul 2020 | 748 | $433,160 | $229.14 | 57 | 588 | 1,037 |
| Jun 2020 | 565 | $407,000 | $223.21 | 58 | 688 | 1,062 |
| May 2020 | 403 | $399,900 | $222.43 | 57 | 720 | 1,048 |
| Apr 2020 | 392 | $415,500 | $219.95 | 51 | 812 | 697 |
| Mar 2020 | 516 | $415,000 | $221.74 | 56 | 774 | 658 |
| Feb 2020 | 459 | $392,500 | $211.63 | 78 | 587 | 816 |
| Jan 2020 | 393 | $405,000 | $216.01 | 88 | 621 | 712 |
| Dec 2019 | 518 | $393,500 | $216.29 | 81 | 779 | 541 |
| Nov 2019 | 455 | $400,000 | $216.54 | 72 | 956 | 683 |
Please post your comments and questions below, and thank you for reading this post.
1. The “Past 13 Months of Home Sales Data” table above is updated on a monthly basis. The median home price data reported covers the cities of Reno, Nevada and Sparks, Nevada [NNRMLS Area #100]. Residential data includes Site/Stick Built properties only. Data excludes Condo/Townhouse, Manufactured/Modular and Shared Ownership properties. Data courtesy of the Northern Nevada Regional MLS – December 2, 2020. Note: This information is deemed reliable, but not guaranteed.
For historical home sale data dating back to 1998 click here.
Click here to see Reno Homes for Sale.


Vale
Hey Guy, thanks for the update. It is pretty amazing how fast the inventory is dwindling!
I have been digging through the publicly available assessor sales data at https://www.washoecounty.us/assessor/online_data/sales_reports.php and using your data as a reference point. I’m curious about some of the differences and am wondering if you might have some insight.
An easy example for this month is within the 100 – 199 price band. The assessor shows 3 sales for Site/Stick Built properties within NNRMLS Area #100 vs. the two shown in your table here.
Those APNs are:
028-213-14 and 033-072-31 (89431)
089-290-10 (89441)
Could the difference come from the type of sale or is it just a difference between the Northern Nevada Regional MLS data and the county assessor data?
Thanks for any input you may have.
Guy Johnson
Hello Vale,
Good question. The property (APN 028-213-14) was not listed on the MLS; hence the sale will not appear in the MLS search.
This is the same situation with the parcel (APN 089-290-10). It was not listed on the MLS.
Our MLS shows two residential sales in the $100,000 – $199,999 price band for November. These two sales are for APNs 033-072-31 and 011-214-16.
So, in answer to your question the discrepancy is simply a difference between the Northern Nevada Regional MLS data and the County Assessor’s data?
Hope this helps,
Guy
Vale
Hello Guy – yes, thank you that is incredibly helpful. I would not have guessed they would be that far apart, but it explains a lot. Thank you as always for your detailed response!
Guy Johnson
You’re welcome.