
Ed. Note: Data updated January 6, 2021
December home sales set a December record; December’s median sold PPSF surpasses $250/sq.ft. and sets an all-time high; Available inventory drastically low — down 72% Y-o-Y!
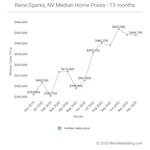
December’s median sold home price for Reno-Sparks came in at $449,600 — essentially unchanged from November’s median sales price of $450,000.
Year-over-year, December’s median closed sales price was up a whopping 14.1 percent! This equates to an increase of $55,600 in the median sales price year-over-year.
December’s median sold price per square foot (PPSF) jumped to $250.77/sq.ft. — a 3.4 percent increase over November’s sold PPSF of $242.43/sq.ft. December’s median sold PPSF also sets an all-time high for this metric.
Year-over-year, December’s median sold PPSF is up 15.9 percent!
Homes Sold
548 SFRs sold in December — setting a record high number of homes sold during any December [The previous record was set in December 2011 when 534 homes sold for the month.]
Though down 9.4 percent from November’s record-setting number of homes sold, December’s homes sold was up 6.0 percent year-over-year.
After catching and then surpassing 2019 year-to-date home sales in September 2020, home sales continued to outperform in the 4th quarter.
Total home sales in 2020 came in at 6,625 units. That number represents a 5.5 percent increase over the 6,279 homes sold in 2019. And 2020’s total is 2nd only to the number of 6,837 homes sold in 2017.
Inventory
Currently there are only 218 homes available for purchase in the Reno-Sparks market. This number is down 21.6 percent from the 278 homes available for sale this time last month.
And year-over-year, current available inventory is down an incredible 72.0 percent! Yes, last year at this time 779 homes were available for purchase — today there are 218!
And the picture becomes even bleaker when one looks at the available inventory of homes priced at, or below, the current median sales price of $449,700. Currently only 54 homes (24.8 percent) are priced at, or below, the median sales price.
Presently, 621 homes are pending sale in the Reno-Sparks market. That number is down 22.1 percent from November’s 797 pending sales. However, year-over-year, December’s pending sales are up 14.8 percent.
Days on Market and Days to Contract
December’s median days on market (DOM) came in at 50 days — a decrease of 2 days from November’s median DOM. Year-over-year December’s DOM is a whopping 32 days (or 39.0 percent) lower than December 2019’s DOM. These numbers show the relative velocity the current market.
December’s median days to contract (DTC) came in at 4 days — a decrease of one day from November’s median DTC. Year-over-year, December’s DTC number is 18 days lower than December 2019’s 22 DTC. Again, reflecting the velocity the current market.
Sales by Type
December sales by type, break out as follows:
- REO sales: 0.4% – down from November’s 0.9%
- Short sales: 0.2% – up over November’s 0%
- Subject to Court Approval sales: 1.0% – up over November’s 0.5%
- Relocation sales: 0.4% – up over November’s 0%
- Equity sales: 98.1% – down from November’s 98.6%
Sales by Price
December sales by price band break out as follows…
| sales price ($000’s) | units sold | % of sales | cumulative % of sales |
| 0 – 99 | 0 | 0.0% | 0.0% |
| 100 – 199 | 2 | 0.4% | 0.4% |
| 200 – 299 | 25 | 4.5% | 4.9% |
| 300 – 399 | 157 | 28.6% | 33.5% |
| 400 – 499 | 136 | 24.8% | 58.3% |
| 500 – 599 | 85 | 15.5% | 73.8% |
| 600 – 699 | 44 | 8.0% | 81.8% |
| 700 – 799 | 21 | 3.8% | 85.6% |
| 800 – 899 | 23 | 4.2% | 90.0% |
| 900 – 999 | 18 | 3.3% | 93.2% |
| 1M+ | 37 | 6.8% | 100% |
| total | 548 | 100% |
December’s median sold price for houses and condos combined was $425,000 — a 1.2 percent decrease from November’s median sold price of $430,000 for combined sales of houses and condos. Year-over-year, December’s number is up 14.9 percent.
The table below contains the past 13 months of data[1]…
| Month Year | # Sold | Median Sold Price | Sold Price per Sq Ft | Median DOM | # of Actives | # of Pendings |
| Dec 2020 | 548 | $449,600 | $250.77 | 50 | 218 | 621 |
| Nov 2020 | 605 | $450,000 | $242.43 | 52 | 278 | 797 |
| Oct 2020 | 631 | $455,000 | $237.94 | 50 | 385 | 979 |
| Sep 2020 | 700 | $440,000 | $239.32 | 49 | 432 | 1,013 |
| Aug 2020 | 658 | $442,250 | $228.32 | 54 | 468 | 1,068 |
| Jul 2020 | 750 | $433,160 | $229.14 | 57 | 588 | 1,037 |
| Jun 2020 | 565 | $407,000 | $223.21 | 58 | 688 | 1,062 |
| May 2020 | 404 | $399,900 | $222.46 | 57 | 720 | 1,048 |
| Apr 2020 | 392 | $415,500 | $219.95 | 51 | 812 | 697 |
| Mar 2020 | 518 | $415,000 | $221.74 | 56 | 774 | 658 |
| Feb 2020 | 460 | $392,750 | $211.79 | 78 | 587 | 816 |
| Jan 2020 | 394 | $405,000 | $215.99 | 89 | 621 | 712 |
| Dec 2019 | 517 | $394,000 | $216.38 | 82 | 779 | 541 |
1. The “Past 13 Months of Home Sales Data” table above is updated on a monthly basis. The median home price data reported covers the cities of Reno, Nevada and Sparks, Nevada [NNRMLS Area #100]. Residential data includes Site/Stick Built properties only. Data excludes Condo/Townhouse, Manufactured/Modular and Shared Ownership properties. Data courtesy of the Northern Nevada Regional MLS – January 3, 2021 [Data revised January 6, 2021]. Note: This information is deemed reliable, but not guaranteed.
For historical home sale data dating back to 1998 click here.
Click here to see Reno Homes for Sale.


