
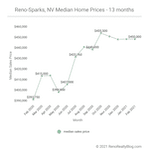
February’s median sold home price for Reno-Sparks held steady at $450,000 — Nearly unchanged from January’s median sales price of $449,900 and December’s $449,800.
Year-over-year, February’s median closed sales price was up a hefty 14.6 percent.
February’s median sold price per square foot (PPSF) increased to $258.57/sq.ft. — a 2.2 percent increase over January’s sold PPSF of $253.12/sq.ft. February’s median sold PPSF also sets an all-time high for this metric.
Year-over-year, February’s median sold PPSF is up a whopping 22.1 percent!
Homes Sold
381 homes sold in February. This number was up just slightly, 1.1 percent, over the 377 homes sold in January.
Year-over-year, February’s home sales were down a notable 17.2 percent — due to extreme low inventory.
Inventory
Currently only 257 homes are available for purchase in the Reno-Sparks market. Although the current available inventory is up 53.9 percent over January’s record-setting low inventory, it still represents less than a one-month supply of homes for sale.
And the picture becomes even bleaker when one looks at the available inventory of homes priced at, or below, the current median sales price of $450,000. Currently only 90 homes (35.0 percent) are priced at, or below, the median sales price in the Reno-Sparks market.
Year-over-year, current available inventory is down a whopping 56.2 percent.
Surprisingly (given the dismal inventory), 698 homes are presently pending sale in the Reno-Sparks market. That number is up 11.1 percent over January’s 628 pending sales this time last month. However, year-over-year, January’s pending sales are down 14.5 percent.
Days on Market and Days to Contract
February’s median days on market (DOM) came in at 43 days — a substantial reduction of 11 days from January’s median DOM of 54 days. Year-over-year, February’s DOM is a whopping 35 days (or 44.9 percent) lower than February 2020’s DOM. These numbers show the velocity the current market.
February’s median days to contract (DTC) came in at 4 days — unchanged from January’s median DTC. Year-over-year, February’s DTC number is 12 days lower than February 2020’s 16 DTC.
Sales by Type
February sales by type, break out as follows:
- REO sales: 0.5% – unchanged from January’s 0.5%
- Short sales: 0.3% – down from January’s 0.5%
- Subject to Court Approval sales: 1.3% – down from January’s 3.0%
- Relocation sales: 0.7% – up over January’s 0%
- Equity sales: 97.1% – up over January’s 96.0%
Sales by Price
February sales by price band break out as follows…
| sales price ($000’s) | units sold | % of sales | cumulative % of sales |
| 0 – 99 | 0 | 0.0% | 0.0% |
| 100 – 199 | 2 | 0.5% | 0.5% |
| 200 – 299 | 16 | 4.2% | 4.7% |
| 300 – 399 | 105 | 27.6% | 32.3% |
| 400 – 499 | 106 | 27.8% | 60.1% |
| 500 – 599 | 57 | 15.0% | 75.1% |
| 600 – 699 | 34 | 8.9% | 84.0% |
| 700 – 799 | 17 | 4.4% | 88.5% |
| 800 – 899 | 9 | 2.4% | 90.8% |
| 900 – 999 | 8 | 2.1% | 92.9% |
| 1M – 1.5M | 15 | 3.9% | 96.8% |
| 1.5M+ | 12 | 3.1% | 100% |
| total | 381 | 100% |
February’s median sold price for houses and condos combined was $416,000 — a 0.7 percent decrease from January’s median sold price of $418,997 for combined sales of houses and condos. Year-over-year, February’s number is up 7.6 percent.
The table below contains the past 13 months of data[1]…
| Month Year | # Sold | Median Sold Price | Sold Price per Sq Ft | Median DOM | # of Actives | # of Pendings |
| Feb 2021 | 381 | $450,000 | $258.57 | 43 | 257 | 698 |
| Jan 2021 | 377 | $449,900 | $253.12 | 54 | 167 | 628 | Dec 2020 | 554 | $449,800 | $251.44 | 50 | 218 | 621 |
| Nov 2020 | 606 | $452,520 | $242.69 | 52 | 278 | 797 |
| Oct 2020 | 630 | $455,500 | $237.11 | 50 | 385 | 979 |
| Sep 2020 | 699 | $440,000 | $239.25 | 49 | 432 | 1,013 |
| Aug 2020 | 658 | $442,450 | $228.32 | 54 | 468 | 1,068 |
| Jul 2020 | 750 | $433,160 | $229.14 | 57 | 588 | 1,037 |
| Jun 2020 | 565 | $407,000 | $223.21 | 58 | 688 | 1,062 |
| May 2020 | 404 | $399,900 | $222.46 | 57 | 720 | 1,048 |
| Apr 2020 | 392 | $415,500 | $219.95 | 51 | 812 | 697 |
| Mar 2020 | 518 | $415,000 | $221.74 | 56 | 774 | 658 |
| Feb 2020 | 460 | $392,750 | $211.79 | 78 | 587 | 816 |
1. The “Past 13 Months of Home Sales Data” table above is updated on a monthly basis. The median home price data reported covers the cities of Reno, Nevada and Sparks, Nevada [NNRMLS Area #100]. Residential data includes Site/Stick Built properties only. Data excludes Condo/Townhouse, Manufactured/Modular and Shared Ownership properties. Data courtesy of the Northern Nevada Regional MLS – March 13, 2021. Note: This information is deemed reliable, but not guaranteed.
For historical home sale data dating back to 1998 click here.
Click here to see Reno Homes for Sale.


February 2021 Market Report for Reno and Sparks, Nevada - ReInvestmentNews
[…] Credit: Source link […]