
Reno-Sparks median sales price blasts through a half a million dollars!
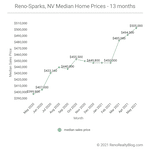
Well, it was only a matter of time, but the median sales price for homes in the Reno and Sparks, Nevada market has now surpassed a half-million dollars — coming in at $505,000.
May’s median sales price of $505,000 sets another new all-time high for the Reno-Sparks housing market. May’s median sales price was up 2.1 percent over April’s, and up a whopping 26.3 percent year-over-year.
May’s median sold price per square foot (PPSF) increased to $284.53/sq.ft. — also setting a new all-time high for this metric.
May’s median sold PPSF was a 4.4 percent increase over April’s sold PPSF of $272.44/sq.ft. Year-over-year, May’s median sold PPSF is up an eye-popping 27.9 percent! The sold PPSF continues to increase at a greater rate than the median sales price.
Homes Sold
530 homes sold in May. This number represents an 8.6 percent pull back from the 580 homes sold in April. Low inventory continues to impact home sales..
Year-over-year, May’s home sales were up a robust 31.2 percent. However, keep in mind that a year ago home sales had dropped off precipitously due to the coronavirus pandemic.
Inventory
Currently only 246 homes are available for purchase in the Reno-Sparks market — representing less than a two-week supply of homes for sale. That being said, the current available inventory is up 16.6 percent from this time last month.
Year-over-year, available inventory is down a staggering 65.8 percent.
And the picture becomes even bleaker when one looks at the available inventory of homes priced at, or below, the current median sales price of $505,000. Currently only 71 homes (28.9 percent) are priced at, or below, the median sales price in the Reno-Sparks market.
Surprisingly (given the dismal inventory), 857 homes are presently pending sale in the Reno-Sparks market. That number is up 10.2 percent over April’s 778 pending sales this time last month. However, pending sales are down 18.2 percent year-over-year.
Days on Market and Days to Contract
May’s median days on market (DOM) came in at 42 days — a one-day increase over April’s median DOM of 41 days. Year-over-year, May’s DOM is 9 days lower than May 2020’s DOM. These numbers show the velocity the current market.
May’s median days to contract (DTC) came in at 4 days — unchanged from April’s median DTC, and also unchanged year-over-year.
Sales by Type
May sales by type, break out as follows:
- REO sales: 1.1% – up over April’s 0.3%
- Short sales: 0% – down from April’s 0.2%
- Subject to Court Approval sales: 0.9% – down from April’s 1.6%
- Relocation sales: 0.8% – up over April’s 0.5%
- Auction sales: 0% – down from April’s 0.2%
- Equity sales: 97.2% – unchanged from April’s 97.2%
Sales by Price
May sales by price band break out as follows…
| sales price ($000’s) | units sold | % of sales | cumulative % of sales |
| 0 – 99 | 0 | 0.0% | 0.0% |
| 100 – 199 | 1 | 0.2% | 0.2% |
| 200 – 299 | 5 | 0.9% | 1.1% |
| 300 – 399 | 89 | 16.8% | 17.9% |
| 400 – 499 | 164 | 30.9% | 49.0% |
| 500 – 599 | 85 | 16.0% | 65.1% |
| 600 – 699 | 71 | 13.4% | 78.5% |
| 700 – 799 | 38 | 7.2% | 85.7% |
| 800 – 899 | 23 | 4.3% | 90.0% |
| 900 – 999 | 8 | 1.5% | 91.5% |
| 1M – 1.5M | 31 | 5.8% | 97.4% |
| 1.5M+ | 15 | 2.8% | 100% |
| total | 530 | 100% |
May’s median sold price for houses and condos combined was $476,000 — a 3.0 percent increase over April’s median sold price of $462,000 for combined sales of houses and condos. Year-over-year, May’s number is up 23.6 percent.
The table below contains the past 13 months of data[1]…
| Month Year | # Sold | Median Sold Price | Sold Price per Sq Ft | Median DOM | # of Actives | # of Pendings |
| May 2021 | 530 | $505,000 | $284.53 | 42 | 246 | 857 |
| April 2021 | 580 | $494,500 | $272.44 | 41 | 211 | 778 |
| Mar 2021 | 469 | $485,000 | $262.18 | 42 | 226 | 768 |
| Feb 2021 | 386 | $450,000 | $258.20 | 43 | 257 | 698 |
| Jan 2021 | 377 | $449,900 | $253.12 | 54 | 167 | 628 | Dec 2020 | 554 | $449,800 | $251.44 | 50 | 218 | 621 |
| Nov 2020 | 606 | $452,520 | $242.69 | 52 | 278 | 797 |
| Oct 2020 | 630 | $455,500 | $237.11 | 50 | 385 | 979 |
| Sep 2020 | 699 | $440,000 | $239.25 | 49 | 432 | 1,013 |
| Aug 2020 | 658 | $442,450 | $228.32 | 54 | 468 | 1,068 |
| Jul 2020 | 750 | $433,160 | $229.14 | 57 | 588 | 1,037 |
| Jun 2020 | 565 | $407,000 | $223.21 | 58 | 688 | 1,062 |
| May 2020 | 404 | $399,900 | $222.46 | 57 | 720 | 1,048 |
1. The residential housing market data reported on above covers the cities of Reno, Nevada and Sparks, Nevada [NNRMLS Area #100]. Market data includes SFR (Single Family Residence) properties only. Data excludes Condo/Townhouse, Manufactured/Modular properties. Data courtesy of the Northern Nevada Regional MLS – June 2, 2021. Note: This information is deemed reliable, but not guaranteed.
For historical home sale data dating back to 1998 click here.
Click here to see Reno Homes for Sale.


