
According to the latest CoreLogic Home Price Index (HPI®) Report: National home prices increased 3.7% year over year in November 2019 and are forecast to increase 5.3% from November 2019 to November 2020.
Recently I published a blog post where I attempted to forecast where Reno-Sparks home prices would be at the end of this year (2020). See Reno housing market forecast 2020
My methodology consisted of applying CoreLogic’s 2020 forecast for home prices nationally to the current median sales price for the Reno-Sparks market after adjusting for the relative difference in home price appreciation for Reno-Sparks compared to that of the U.S. [Again, see Reno housing market forecast 2020 for additional detail.]
Because many readers of this blog are also interested in home prices in other northern Nevada housing markets, I employed the same methodology to other area housing markets in order to derive 2020 forecasts for those markets.
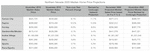
The table below shows the results of that exercise (click on the table to enlarge).

Methodology
The table above contains data for housing markets surrounding the Reno-Sparks metro area. These markets include: Carson City, Dayton, Fernley, Gardnerville/Minden, and Incline Village. I also separated Reno and Sparks, and included data for each in the table.
For each market I reported the median sales price for the 12-month periods: December 2017 – November 2018; and December 2018 – November 2019. I chose time periods ending on the month of November in order to correspond with the time period reported on in the aforementioned CoreLogic report.
After determining the median sales price for each of the 12-month periods, I calculated the percent increase in median sales price appreciation for each of the markets in the table.
Given the rate of home price appreciation, I then calculated two home price forecasts for 2020 [see the last two columns in the table]. One forecast assumed a market’s identical rate of growth as observed in 2019; the other forecast utilized a revised (upward) rate of home price appreciation that was based off of CoreLogic’s projection for home prices nationally after adjusting for the relative difference in home price appreciation for Reno-Sparks compared to that of the U.S.
Forecasts / Findings
While the two forecasts [see the last two columns in the table] provide a range where the 2020 median home price for each market may land, it is the differences in home price appreciation observed across markets that is particularly noteworthy.
Dayton, Nev. saw the largest home price appreciation with a 10.2 percent increase in the median homes price in 2019 over 2018. After Dayton was Carson City, Nev. with an 8.1 percent increase in the median homes price in 2019 over 2018; followed by Fernley, Nev. with a 6.0 percent increase; followed by Incline Village, Nev. with a 5.7 percent increase in its median sales price over the same time periods. Each of these markets saw substantially higher rates of increase over Reno and Sparks 3.7 and 3.6 percent increases, respectively.
At the lower end of the appreciation scale was the Gardnerville/Minden market, which saw a 3.1 percent growth in home prices — below the national home price year-over-year appreciation of 3.7 percent for the same time period.
Is there a northern Nevada market in which you’re interested that I did not include? If so, let me know in the comments below.
Thank you for reading the Reno Realty Blog. – Guy


Justin R
Guy,
What are your thoughts about overall affordability in the Reno/Sparks market? It appears based on some recent job growth projections that Reno/Sparks will top the nation, or be very close to, in job growth as a % of total employment for the area. My thoughts are this – while job growth and in-migration are very strong in our region (2 – 3 x national average on a relative basis), you illustrate above that the local housing values are only increasing by the national average (3.7%) and not exceeding it, while the more affordable markets (Dayton, Carson & Fernley) are increasing much more so (as their base pricing is much less to begin with). Does this mean that we are hitting an affordability limit and upward price adjustments will be minimal going forward in the Reno/Sparks area, keeping in consideration the forecasted job growth / population growth planned for the area?
PS. Love what you are doing with this blog and the constant flow of information, keep it up!
Guy Johnson
Thank you for your questions, Justin. And thank you for your kind words. I am happy to hear that you find the information provided by this blog of value.
Regarding your question, lack of affordable housing is the greatest challenge facing our local housing market. [Actually, at the national level, as well.] Our area has fewer affordable housing units than are needed — resulting in home prices being driven up — to the point of, as you point out, no longer being able to be purchased by the average home buyer. So, yes, it follows that many of those home buyers would seek out more affordable surrounding areas, such as Dayton, Fernley, and Carson City.
Exacerbating Reno-Sparks’ lack of affordable inventory is that the area’s population growth is outpacing new home construction deliverables. Yesterday I attended the Economic Development Authority of Western Nevada (EDAWN)’s Annual State of the Economy in Northern Nevada Economic Update luncheon. Here’s an interesting slide that illustrates the deficit in new home starts (click to enlarge).
Some of the ideas floated to address the affordable housing issue were:
I welcome your thoughts on some of these ideas.
You also mentioned the region’s job growth. Check out this slide from one of yesterday’s presenters (click to enlarge)…
This slide shows Employment Growth for the 30 Largest MSAs (metropolitan statistical areas) in the country. The dotted line shows Reno, Nevada’s employment growth relative to those MSAs.
The Reno, NV MSA is currently the #1 MSA in the country for Job Growth; and the #3 MSA for Economic Strength.
And here’s a slide from yesterday’s EDAWN presentation showing Washoe County’s projected population and job growth through 2030 (click to enlarge)…
Thank again for reading the Reno Realty Blog.
Here are a couple links to recaps of yesterday’s EDAWN presentation:
Justin R
Thank you Guy, to answer your question, yes the above information is extremely helpful & informative! I really appreciate the time you invested to provide all the above information, truly remarkable seeing what is happening to our local region!