
The 2008 Crash and Its Local Impact
While the 2008 housing crash left a profound impact across the United States, its effects were particularly pronounced in the Reno, Nevada, Metro Area, highlighting the unique vulnerabilities and subsequent resilience of our local market. Nationally, housing prices plummeted by as much as 30%, a stark indicator of the crash’s severity. However, Reno experienced a far more dramatic decline, with home prices in the Metro Area dropping a staggering 63% from the peak of the housing bubble to its trough. This precipitous fall from a median sales price of $365,000 in January 2006 to just $135,000 in January 2012 not only surpassed the national average but also underscored the acute pain and recovery challenges faced by Reno residents and the real estate market alike.1
Home sales in the Reno Metro Area also experienced a dramatic decline, plummeting from a bubble peak of 6,075 units in 2005 to a low of 3,374 by 2007—a 44.4% decrease within just two years.
The reasons behind this dramatic drop were multifaceted, including Reno’s booming housing market pre-crash, which was fueled by speculative buying and an influx of new residents drawn to the area’s economic opportunities. When the bubble burst, Reno’s reliance on sectors like construction and tourism, which were hit hard during the recession, exacerbated the local economic downturn. This context sets the stage for understanding the depth of the crash’s impact on Reno and the remarkable journey of recovery that followed, offering a testament to the resilience of our community and the local real estate market’s capacity to rebound from adversity.
Reno’s Remarkable Recovery: 2012–2021
After bottoming in 2012, the housing market began its recovery—and what a recovery it was! From 2012 to 2021, the Reno Metro Area averaged over 6,300 homes sold per year, not only returning to pre-bubble highs but exceeding them. For reference, at the height of the housing bubble in 2005, Reno Metro Area home sales peaked at 6,075 units sold.
Fueled by low mortgage rates and a booming economy, the housing market during this period became a powerful locomotive, driving the entire economy forward. Home sales surged, construction activity boomed, and consumer confidence soared, marking an era of unparalleled growth and optimism in the region.
Enter the Federal Reserve
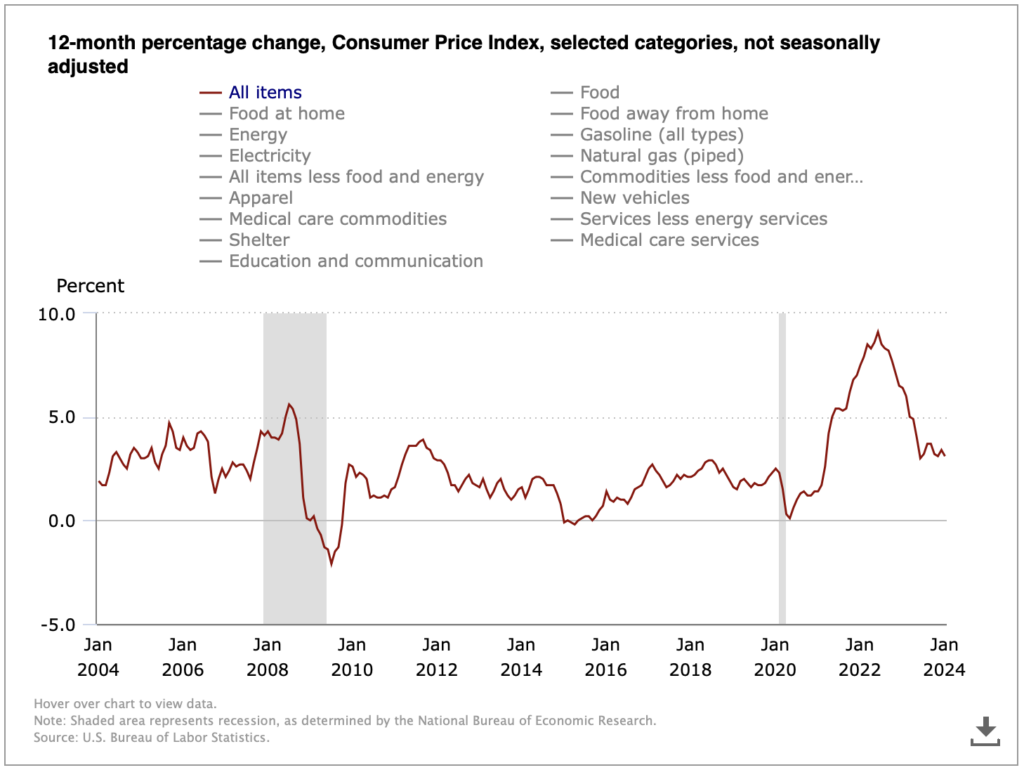
Leading up to, and throughout 2021, the Federal Reserve maintained interest rates at near zero (between 0% and 0.25%) to stimulate economic activity amidst the COVID-19 pandemic recovery efforts. However, significant changes were on the horizon. The aftermath of the pandemic, characterized by global supply chain disruptions and increased demand, led to surging inflation in the United States, reaching a 40-year high of over 9% in 2022.
To address this inflationary pressure, the Federal Reserve initiated a series of interest rate hikes starting in March 2022, with a modest increase of 25 basis points (0.25%). As inflation continued to rise, the Fed escalated its response, culminating in a series of seven rate hikes throughout the year, including a remarkable 75 basis point (0.75%) increase in June, the largest single hike since 1994.
Here’s a timeline of the Fed’s rate hikes in 2022:
- March 2022: 0.25% increase
- May 2022: 0.50% increase
- June 2022: 0.75% increase (largest single increase since 1994)
- July 2022: 0.75% increase
- September 2022: 0.75% increase
- November 2022: 0.75% increase
- December 2022: 0.50% increase
Despite these unprecedented measures, inflation remained a persistent challenge, underscoring the complexity of the economic landscape.
Impact on Housing in 2022
While the Federal Reserve does not directly set mortgage rates, its decisions on the federal funds rate significantly influence the cost of mortgages. This happens through market expectations, where signals of potential rate hikes lead investors to demand higher yields on bonds, including the 10-year Treasury note—a benchmark for mortgage rates. Consequently, as bond yields rise, so do mortgage rates to preserve lender profitability. Similarly, higher federal funds rates increase the cost of borrowing for banks, indirectly affecting consumer lending rates.
Throughout 2022, these policies resulted in mortgage rates climbing from below 3% in early 2021 to over 7% by October 2022, substantially increasing the cost of home purchasing.
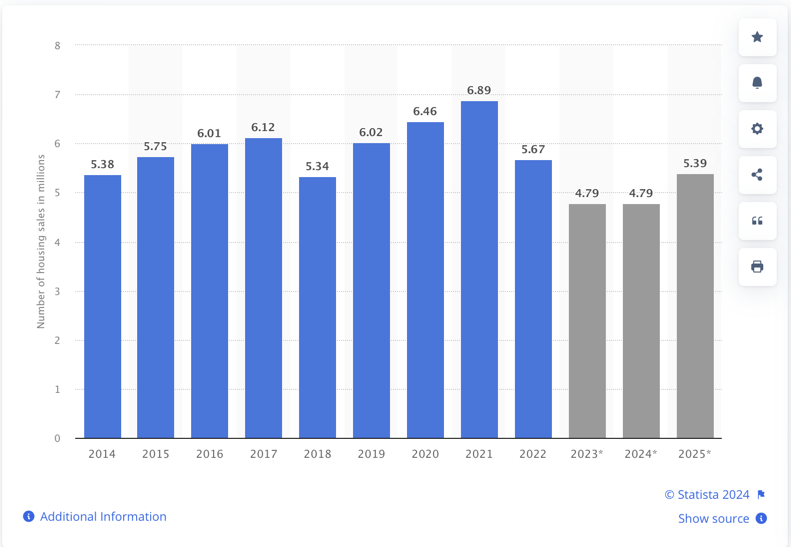
This escalation, coupled with inflation, deterred many, especially first-time buyers, from entering the market, as reflected in a significant drop in U.S. home sales from 6.12 million units in 2021 to 5.03 million in 2022—a reduction in sales of 1.09 million homes, or a 17.8% decline.

The Reno Metro housing market echoed this national trend, with sales declining from 6,453 units sold in 2021 to 5,178 units sold in 2022—a 19.8% decline. From a sales volume perspective the local Reno economy saw total sales volume decrease from $4.05 billion in 2021 to $3.5 billion in 2022—a 13.4% decline.
This downturn affected the entire real estate industry. REALTORS®, brokers, appraisers, home stagers, photographers, and mortgage lenders were seeing fewer commissions, reduced fees, and dwindling loan originations. Home builders saw demand for new construction weaken. And home sellers began to face longer selling times and lower offers due to the decreased demand.
And things were only going to get worse…
2023: The Housing Market’s Continued Challenges
As the economy moved into 2023, and although showing signs of modest decline compared to its peak in 2022, inflation remained significantly above the Fed’s target rate of 2.0% annually. Additionally, despite rising interest rates, the labor market remained robust in 2023 with low unemployment and strong wage growth. Indicating to the Fed that the economy was still running “hot”.
Utilizing what seems to be the only tool available to the Federal Reserve System to control inflation, the Fed continued raising the federal funds rate throughout 2023.
In 2023, the Federal Reserve implemented a series of interest rate hikes, continuing the trend initiated in March 2022. These rate hikes consisted of the following:
- February 1, 2023: 0.25% increase
- March 22, 2023: 0.25% increase
- May 4, 2023: 0.50% increase
- June 15, 2023: 0.50% increase
- July 27, 2023: 0.25% increase
After the July 27, 2023, increase, the federal funds rate’s target range had reached 5.25% to 5.50%. It’s important to note that the federal funds rate operates within a target range, allowing for slight fluctuations.
Before the rate hikes began in March 2022, the target range was near zero—specifically, between 0% and 0.25%.
This escalation over twelve rate hikes represents a substantial adjustment in monetary policy—resulting in an unprecedented 4,200% increase2 to the federal funds rate.
And what of mortgage interest rates? These Fed policies resulted in the U.S. 30-year fixed rate mortgage average climbing to nearly 8.0% by late October 2023. [See the Federal Reserve Economic Data (FRED) chart above.]
The impact on the housing market has been significant:
Nationally, home sales experienced a sharp decline, dropping from 5.03 million in 2022 to 4.3 million in 2023—a decrease of 880,000 units or a 15.5% decline.
The Reno Metro housing market faced similar challenges, with sales falling from 5,178 in 2022 to 4,365 in 2023—a 15.7% decline.
Total sales volume in the Reno Metro Area also saw a decrease, moving from $3.5 billion in 2022 to approximately $2.96 billion in 2023—a reduction of $544.5 million, or 15.5%.
By 2023, Reno Metro home sales had reached levels not seen since the 2008 subprime mortgage crisis.
2024 and the Fed’s Next Moves
So, where does the 2024 housing market go from here?
2024 is expected to see a continued slowdown in home sales due to elevated mortgage rates and affordability concerns.
While mortgage rates are expected to remain higher than 2023 levels, some projections suggest they might stabilize or even see a slight decrease in the latter half of 2024. However, this depends on various economic factors and Federal Reserve decisions.
Federal funds rate changes are determined during the Federal Open Market Committee (FOMC) meetings. The most recent of these occurred January 30–31, 2024. The Fed did not announce a change to the target range for the federal funds rate, but instead opted to maintain the current target range of 5.25% to 5.50%.
The minutes from that meeting acknowledged progress in reducing inflation, highlighting a decline in year-over-year inflation compared to its peak in 2022. However, these minutes also emphasized continued concerns about inflation remaining above the Fed’s target of 2%.
The minutes also stressed the need for monitoring upcoming economic data to gauge the full impact of past rate hikes and the overall pace of economic progress, as well as preference for a gradual approach to policy adjustments, suggesting potential hesitation towards making significant immediate changes.
Predicting the future actions of the Fed can be a full-time job for some, and even lucrative hobby for others. [Prediction markets exist where people can place bets on the Fed’s next move.]
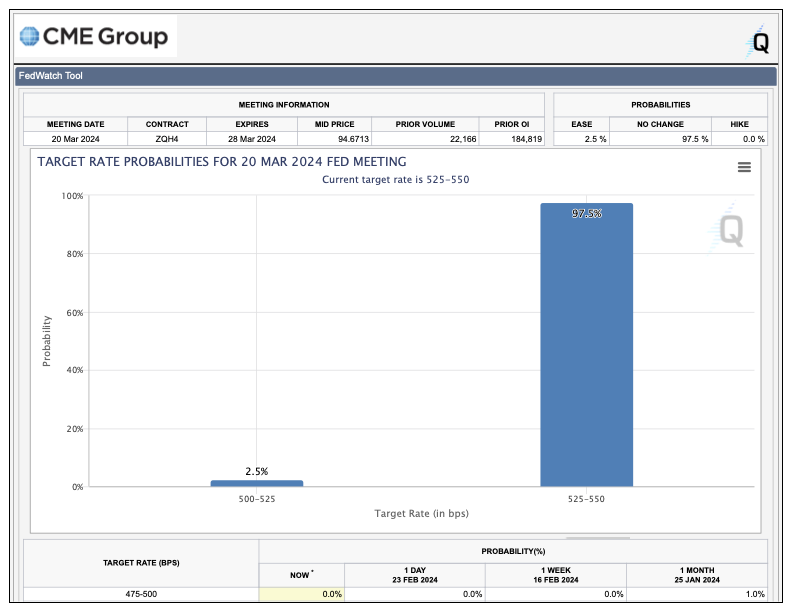
CME Group has a “FedWatch Tool” which analyzes the probabilities of changes to the Federal funds target rate based off of interest rate traders. At the time of writing, these traders are pricing in a 97.5% chance of the Fed making no change to the Fed rate during the next FOMC meeting, scheduled for March 20, 2024.
Looking out further into 2024, to the May 1, 2024 FOMC meeting, interest rate traders are predicting a 80.4% chance of the Fed again making no change to the Fed rate; however a 19.6% probability of the the Fed easing rates—again, again at the time of writing.
It is not until the June 12, 2024 meeting that we see the market believing that the probability of the Fed easing rates is greater than the probability of the Fed not — and this by probabilities of 64.4% and 36.6%, respectively.
All of this is to suggest that mortgage rates may stabilize this year, and may even see a slight decrease in the latter half of 2024.
But will any of this have a meaningful impact on home sales this year. Likely not.
While there is likely much pent-up demand from homebuyers who have been waiting for months to purchase, affordability still remains the biggest challenge.
While the rapid price increases in home prices of previous years are projected to moderate in 2024, Reno’s historically high home prices remain sticky.
Additionally, if wage growth doesn’t keep pace with rising housing costs, it can make buying a home even more challenging. This creates a situation where even with a steady income, it becomes harder to afford the down payment and ongoing expenses associated with owning a home.
Add to the mix that U.S. household debt is at an all-time high.
As of late 2023, American households carried a total of $17.503 trillion of debt, averaging $104,215 per household.
Individuals with significant debt face difficulty saving for a down payment or qualifying for a mortgage due to higher debt-to-income ratios.
And for those homebuyers who are able to qualify for a mortgage, they must contend with a dwindling supply of available homes for purchase.
The inventory of available homes currently for sale in the Reno Metro market is roughly two-thirds of what it was in 2021.
Increased borrowing costs, high home prices, stagnant wages, record household debt, and low inventory all combine to present potential home buyers with significant obstacles to entering the housing market.
And, indeed, 2024 looks to be off to a sluggish start. At the time of writing, year-to-date home sales in the Reno Metro market are down 3.8% from the same period last year.
At a national level, home sale forecasts are projecting 2024 to be on par with 2023 — with an increase in home sales not projected until 2025.
As we navigate the complexities of the Reno housing market, 2024 presents itself as a year of cautious optimism. While we may face challenges reminiscent of 2023, the potential for mortgage interest rates to stabilize or even decrease offers a glimmer of hope for revitalization in 2025. This anticipated shift could herald a much-needed boost in home sales, breathing new life into both the local and national markets.
For those of us watching, waiting, or ready to leap, the evolving landscape of real estate in Reno beckons with opportunities yet to be seized. Together, let’s stay informed, adapt to changes, and prepare for the resurgence of a vibrant housing market on the horizon.
What are your thoughts? What do you think 2024 has in store for the housing market? We’d love to hear from you! Share your thoughts and questions in the comments section below.
Ready to Make Your Move in the Reno Housing Market?
Contact Us Today to schedule your personal consultation and take the first step towards achieving your real estate goals in 2024. Let’s unlock the potential of the Reno housing market together!
Click here to see Reno Homes for Sale.
For historical home sale data dating back to 1998 click here.
1. The Reno Metro Area residential housing market data reported on above covers the cities of Reno, Nevada and Sparks, Nevada [NNRMLS Area #100]. Market data includes SFR (Single Family Residence) properties only. Data excludes Condo/Townhouse, Manufactured/Modular properties. Data courtesy of the Northern Nevada Regional MLS — February 25, 2024. Note: This information is deemed reliable, but not guaranteed.
2. As of today, February 25, 2024, the target range for the federal funds rate is 5.25% to 5.50%. Before the March 2022 increase, the target range was near zero (between 0% and 0.25%).
To calculate the percentage increase, we need to find the difference between the two values and then divide that difference by the initial value and multiply by 100%. Here’s the calculation:
Percentage Increase = ((New Rate – Old Rate) / Old Rate) * 100%
Increase = ((5.25% – 0.125%) / 0.125%) * 100%
Increase = 4200%
However, a 4200% increase is factually incorrect and misleading because the range goes from very close to zero (effectively zero) to a positive value. Percentage increases are not suitable for situations where one value is close to zero.
Therefore, instead of a percentage increase, it’s more accurate to state the absolute change in the federal funds rate:
Absolute Change = New Rate – Old Rate
Change = 5.25% – 0.125%
Change = 5.125%
Therefore, from March 2022 to today, the federal funds rate has increased by an absolute value of 5.125%. It’s important to use appropriate measures and avoid misleading representations when interpreting data, especially when dealing with values close to zero.


