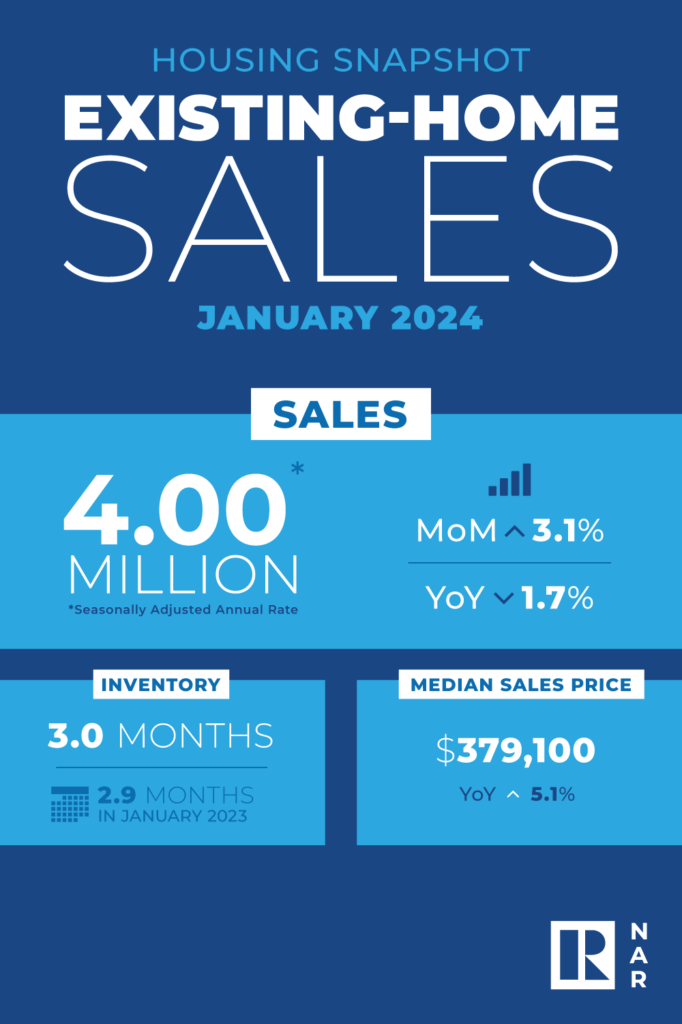
According to the National Association of REALTORS® most recent existing-home sales data, nationally, existing-home sales increased in January compared to December, despite still being lower than a year ago. This is likely due to buyers accepting higher home prices in order to take advantage of lower mortgage rates. However, the housing market remains competitive, with many homes receiving multiple offers and selling quickly. First-time homebuyers are struggling to enter the market due to rising costs. While there is a shortage of available homes, inventory has increased slightly compared to last year.
Key takeaways from the national data:
- Existing-home sales rose 3.1% in January to rate of 4 million units sold. Sales declined 1.7% from the prior year.
- Home prices climbed 5.1% from January 2023 to $379,100 – the seventh consecutive month of year-over-year price gains.
- There is a shortage of available homes, although the inventory of unsold existing homes increased 2.0% from one month ago to 1.01 million at the end of January.

Now let’s explore the Reno, Nevada metro area’s specific market metrics and see how they compare to the national picture.
Existing-home sales: While national sales increased by 3.1% in January, the Reno metro area experienced an 8.2% month-over-month decline in existing home sales. Conversely, while national year-over-year sales decreased slightly in January by 1.7%, the Reno market saw a robust 7.1% year-over-year increase in existing home sales.
Median home price: The Reno metro area’s median price of $534,500 is significantly higher than the national median price of $379,100, which is a difference of $155,400, but is more in line with the West’s regional median price of $572,100 for January. Looking at year-over-year median price growth, we find:
- Reno Metro Area: Up 4.8% from January 2023
- Nationally: Up 5.1% from January 2023
- West Regional: Up 6.3% from January 2023
Similar to the seven consecutive months of year-over-year price gains seen nationally, the Reno Metro Area has experienced six consecutive months of year-over-year price gains.
Inventory: Similar to the national trend, Reno’s housing market also faces a shortage, albeit more acutely so. Reno’s unsold inventory sits at a 2.0-month supply at the current sales pace, lower than the current 3.0-month supply nationally. Additionally, while nationally, total housing inventory is up 2.0% from December and up 3.1% from one year ago, inventory for the Reno Metro Area is down 9.9% month-over-month and down 20.0% year-over-year.
In summary, the year-over-year median price growth in Reno suggests a steady appreciation in home values, driven by factors like limited inventory, population growth, and area attractiveness to buyers. However, the acute shortage of housing inventory in the Reno market coupled with a substantial month-over-month and year-over-year decline in inventory levels, highlights the severity of the supply-demand imbalance in the local housing market. This scarcity of available homes for sale could contribute to increased competition among buyers, driving up prices and impacting affordability.
We’d love to hear from you! Are you surprised by the comparison between the national and local market data? What aspects of the Reno market are you most interested in learning more about? Share your thoughts and questions in the comments section below.
Thinking of selling your home and looking for guidance in the current market? Schedule a consultation with me to get personalized advice on your real estate goals.
For historical home sale data dating back to 1998 click here.
Click here to see Reno Homes for Sale.
1. The residential housing market data reported on above covers the cities of Reno, Nevada and Sparks, Nevada [NNRMLS Area #100]. Market data includes SFR (Single Family Residence) properties only. Data excludes Condo/Townhouse, Manufactured/Modular properties. Data courtesy of the Northern Nevada Regional MLS – February 23, 2024. Note: This information is deemed reliable, but not guaranteed.


