
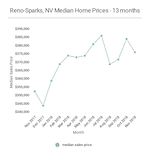
November’s median home sales price was $377,250. This number was down 2.0 percent from October’s median sales price of $385,000. Year-over-year, November’s median sales price is up 6.7 percent.
November’s median sold price per square foot (PPSF) also fell — coming in at $211.65/sq.ft., down 1.1 percent from October’s median sold PPSF of $214.10/sq.ft. November’s median sold PPSF is up 8.7 percent year-over-year.
Units sales in November totaled 456 homes sold for the month — down 2.4 percent from October’s 467 units sold. Year-over-year, home sales are down 14.6 percent from the 534 homes sold in November 2017.
Regarding inventory, presently 1,237 homes are available for purchase in the Reno-Sparks market. Given the current rate of home sales, available inventory equates to about a 2.7 month supply. Currently, available inventory is down 4.8 percent from the 1,300 homes for sales this time last month. Year-over-year, the current number of available homes for purchase is up a whopping 61.3 percent.
However, despite the gains in the number of homes available for purchase only 34.5 percent are priced at, or below, the current median sales price.
Pending sales fell in November. Presently, 634 homes are pending sale in the Reno-Sparks market. That number is down 11.6 percent from the 717 homes pending sale this time last month. Year-over-year, current pending sales are down 11.1 percent from November 2017.
November’s median days on market (DOM) came in at 71 days — an increase of six days over October’s DOM. November’s DOM is up 14.5 percent year-over-year.
November sales by type, break out as follows:
- REO sales: <1% – down from October’s 1%
- Short sales: <1% – unchanged from October’s <1%
- Subject to Court Approval sales: 1% – down from October’s 2%
- Relocation sales: <1% – unchanged from October’s <1%
- Equity sales: 97% – up from October’s 96%
November sales by price band, break out as follows in the table below…
| sales price ($000’s) | units sold | cumulative % of sales |
| 0 – 99 | 1 | 0.2% |
| 100 – 199 | 7 | 1.8% |
| 200 – 299 | 82 | 19.7% |
| 300 – 399 | 161 | 55.0% |
| 400 – 499 | 103 | 77.6% |
| 500 – 599 | 50 | 88.6% |
| 600 – 699 | 21 | 93.2% |
| 700 – 799 | 9 | 95.2% |
| 800 – 899 | 5 | 96.3% |
| 900 – 999 | 5 | 97.4% |
| 1M+ | 12 | 100% |
| total | 456 |
November’s median sold price for houses and condos combined was $355,000 — unchanged from October’s median sold price for combined sales of houses and condos.
The table below contains the past 13 months of data[1]…
| Month Year | # Sold | Median Sold Price | Sold Price per Sq Ft | Median DOM | # of Actives | # of Pendings |
| Nov 2018 | 456 | $377,250 | $211.65 | 71 | 1,237 | 634 |
| Oct 2018 | 467 | $385,000 | $214.10 | 65 | 1,300 | 717 |
| Sep 2018 | 458 | $372,777 | $210.92 | 60 | 1,333 | 725 |
| Aug 2018 | 569 | $370,000 | $211.79 | 57 | 1,208 | 790 |
| Jul 2018 | 566 | $387,000 | $216.32 | 53 | 1,154 | 838 |
| Jun 2018 | 601 | $381,900 | $215.98 | 49 | 923 | 906 |
| May 2018 | 574 | $375,000 | $209.04 | 49 | 725 | 920 |
| Apr 2018 | 491 | $374,000 | $205.34 | 51 | 638 | 891 |
| Mar 2018 | 548 | $375,000 | $200.88 | 50 | 529 | 814 |
| Feb 2018 | 444 | $370,000 | $193.90 | 61 | 528 | 796 |
| Jan 2018 | 406 | $359,950 | $191.74 | 68 | 514 | 782 |
| Dec 2017 | 493 | $345,000 | $194.35 | 69 | 605 | 578 |
| Nov 2017 | 534 | $353,500 | $197.03 | 62 | 767 | 713 |
Thank you for taking the time to read this market report. As always, your comments and questions are welcomed.
1. The medians table above is updated on a monthly basis. The median home price data reported covers the cities of Reno, Nevada and Sparks, Nevada [NNRMLS Area #100]. Residential data includes Site/Stick Built properties only. Data excludes Condo/Townhouse, Manufactured/Modular and Shared Ownership properties. Data courtesy of the Northern Nevada Regional MLS – December 6, 2018. Note: This information is deemed reliable, but not guaranteed.
For historical home sale data back to 1998 click here.


Goin2NV
Something to think about:
https://fred.stlouisfed.org/graph/?g=mmff
Guy Johnson
Thank you for sharing the link Goin2NV.
Timothy Scott Weber
Any info for Fernley this month, Guy?
Guy Johnson
Hello Tim,
I’ll be posting the Reno/Sparks’ Association of REALTORS® Fernley Market Report as soon as they publish it (…likely sometime next week). In the meantime here is an infographic for Fernley’s November numbers…