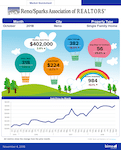
The Reno/Sparks Association of REALTORS® has produced a new infographic for its monthly Market Insights metrics (see below).
The new infographic contains the month-over-month change of the following housing market metrics:
- median sold price
- number of new listings
- active inventory
- number of houses (units) sold
- average days to contract
- sold price per square feet
The three infographics below illustrate Octobers metrics for Reno, Sparks, and Fernley, respectively.
What are your thoughts on the new design?


