
Reno and Sparks, Nev. median sales price jumps 3 percent in one month
Whoa! What a month April saw for area home sales.
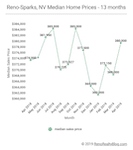
The median home price in Reno-Sparks, Nevada jumped big time to $380,000 in April — wiping out any decline observed in March. April’s median sales price represents a whopping 3.0 percent, one-month, increase over March’s median, and sets a new record high for 2019.
Year-over-year, April’s median sale price is up 1.6 percent.
April’s median sold price per square foot (PPSF) jumped to $214.05/sq.ft. — also representing a 3.0 percent increase over March’s $207.79/sq.ft. Year-over-year, April’s median sold PPSF is up 4.2 percent.
April’s home sales also saw a large increase. 513 homes were sold for the month. This is 56 more homes than sold in March — representing a healthy 12.3 percent increase over March’s number of home sales. Additionally, year-over-year, April home sales were up 4.3 percent over 2018’s number.
Though April’s strong sales helped to mitigate March’s dismal number of sales, year-to-date, home sales are still down 12.9 percent overall. So the market has some catching up to do.
Inventory
Regarding inventory, presently 996 homes are available for purchase in the Reno-Sparks market. This number is up a hefty 14.9 percent from the 867 homes available for sale this time last month. Year-over-year, April’s currently available inventory is up a whopping 56.1 percent.
That being said, despite the number of homes currently available for purchase, only 23.9 percent are priced at, or below, the current median sales price. Lack of affordable inventory remains an issue.
Pending sales also climbed in April. Presently, 923 homes are pending sale in the Reno-Sparks market. That number is up a healthy 13.3 percent over the 815 homes pending sale this time last month. Look for unit sales to increase again in May. Year-over-year, current pending sales are 3.6 percent higher than the number of pending sales in April 2018.
April’s median days on market (DOM) came in at 65 days — a huge decrease of 13 days from March’s median DOM. While a nearly two-week reduction in the median DOM does indicate increasing market velocity (a market beginning to heat up), April’s DOM number is still 27.5 percent higher year-over-year, indicating a relatively slower market than this time last year.
April sales by type, break out as follows:
- REO sales: 2.9% – up from March’s 1.6%
- Short sales: 0.2% – down from March’s 0.5%
- Subject to Court Approval sales: 1.0% – down from March’s 1.1%
- Relocation sales: 0.4% – down from March’s 0.9%
- Equity sales: 95.5% – down from March’s 95.9%
April sales by price band, break out as follows in the table below…
| sales price ($000’s) | units sold | cumulative % of sales |
| 0 – 99 | 0 | 0.0% |
| 100 – 199 | 6 | 1.1% |
| 200 – 299 | 108 | 22.2% |
| 300 – 399 | 179 | 57.1% |
| 400 – 499 | 106 | 77.8% |
| 500 – 599 | 46 | 86.7% |
| 600 – 699 | 24 | 91.4% |
| 700 – 799 | 8 | 91.9% |
| 800 – 899 | 9 | 94.7% |
| 900 – 999 | 8 | 96.3% |
| 1M+ | 19 | 100% |
| total | 513 |
April’s median sold price for houses and condos combined was $350,000 — a 1.4 percent increase over March’s median sold price of $345,000 for combined sales of houses and condos.
The table below contains the past 13 months of data[1]…
| Month Year | # Sold | Median Sold Price | Sold Price per Sq Ft | Median DOM | # of Actives | # of Pendings |
| Apr 2019 | 513 | $380,000 | $214.05 | 65 | 996 | 923 |
| Mar 2019 | 457 | $369,000 | $207.79 | 78 | 867 | 815 |
| Feb 2019 | 362 | $372,150 | $208.84 | 89 | 888 | 774 |
| Jan 2019 | 325 | $362,000 | $210.44 | 86 | 961 | 655 |
| Dec 2018 | 385 | $365,000 | $209.82 | 77 | 1,079 | 541 |
| Nov 2018 | 469 | $377,500 | $211.75 | 71 | 1,237 | 634 |
| Oct 2018 | 468 | $385,000 | $213.86 | 65 | 1,300 | 717 |
| Sep 2018 | 460 | $372,527 | $210.74 | 60 | 1,333 | 725 |
| Aug 2018 | 572 | $370,725 | $211.79 | 57 | 1,208 | 790 |
| Jul 2018 | 567 | $385,000 | $216.37 | 53 | 1,154 | 838 |
| Jun 2018 | 602 | $381,950 | $215.88 | 49 | 923 | 906 |
| May 2018 | 575 | $375,000 | $209.12 | 49 | 725 | 920 |
| Apr 2018 | 492 | $374,000 | $205.46 | 51 | 638 | 891 |
Thank you for taking the time to read this market report. As always, your comments and questions are welcomed.
1. The medians table above is updated on a monthly basis. The median home price data reported covers the cities of Reno, Nevada and Sparks, Nevada [NNRMLS Area #100]. Residential data includes Site/Stick Built properties only. Data excludes Condo/Townhouse, Manufactured/Modular and Shared Ownership properties. Data courtesy of the Northern Nevada Regional MLS – May 3, 2019. Note: This information is deemed reliable, but not guaranteed.
For historical home sale data back to 1998 click here.


SEO Site Audit Expert
Do you think the prices are going to come down soon?
Guy Johnson
Hello SEO Site Audit Expert,
At the moment I see no indications that prices will be coming down in the near future.
Thank you for your question.
May median sales price and other market metrics | Reno, Incline Village, Sparks, Carson City, Fernley, and Northern Nevada Real Estate Blog
[…] strong home sales helped to mitigate year-to-date lagging sales. As of April’s report, YTD sales were down more than 12 percent compared to the same period in 2018. As of today, YTD […]