
Reno-Sparks median sales price up nearly 6% in March — sets new all-time high; March home sales up nearly 10 percent; Pending sales portend weak April and May
March’s median sold home price for Reno-Sparks jumped 5.9 percent for the month to come in at $415,000 — setting a new record high home price for the Reno and Sparks’ markets.
Year-over-year, March’s median closed sales price was up a whopping 12.5 percent.
March’s median sold price per square foot (PPSF) also rose — coming in at $221.57, or 4.1 percent over February’s $212.80/sq.ft.
Year-over-year, March’s median sold PPSF is up 6.6 percent.
Homes Sold
Home sales rose to 503 units sold in March — representing an impressive 10.3 percent increase over February’s 456 homes sold.
Year-over-year, March’s number of homes sold was up 9.8 percent over the 458 homes sold in March 2019.
Inventory
Currently 774 homes are available for purchase in the Reno-Sparks market. This number is up a whopping 31.9 percent over the 587 homes available for sale this time last month. Despite the monthly increase, current available inventory is down 10.7 percent, year-over-year.
Pending sales are dramatically down. Presently, 658 homes are pending sale in the Reno-Sparks market. That number is down a staggering 19.4 percent from the 816 homes pending sale this time last month. This large decrease is likely due to decreased home buying activity caused by the corona virus pandemic, and portends much fewer home sales for April and May.
Current pending sales are down 19.3 percent from the number of pending sales this time last year.
Days on Market and Days to Contract
March’s median days on market (DOM) came in 56 days — a substantial decrease of 23 days (more than three weeks) from February’s median DOM. Year-over-year, March’s DOM number is down 22 days from March 2019’s number.
March’s median days to contract (DTC) fell to 5 days — a substantial decrease of 11 days from February’s median 16 DTC. Year-over-year, March’s DTC number is down 13 days from March 2019’s number.
Expect both DOM and DTC numbers to increase as the effects of the stay-at-home guidelines impact the home buying process.
Sales by Type
March sales by type, break out as follows:
- REO sales: 0.8% – down from February’s 0.9%
- Short sales: 0% – down February’s 0.7%
- Subject to Court Approval sales: 1.2% – down from February’s 1.6%
- Relocation sales: 0.4% – unchanged from February’s 0.4%
- Equity sales: 97.7% – up over February’s 96.4%
Sales by Price
March sales by price band, break out as follows in the table below…
| sales price ($000’s) | units sold | % of sales | cumulative % of sales |
| 0 – 99 | 0 | 0.0% | 0.0% |
| 100 – 199 | 6 | 1.2% | 1.2% |
| 200 – 299 | 47 | 9.3% | 10.5% |
| 300 – 399 | 174 | 34.6% | 45.1% |
| 400 – 499 | 135 | 26.8% | 72.0% |
| 500 – 599 | 63 | 12.5% | 84.5% |
| 600 – 699 | 47 | 9.3% | 93.8% |
| 700 – 799 | 5 | 1.0% | 94.8% |
| 800 – 899 | 4 | 0.8% | 95.6% |
| 900 – 999 | 3 | 0.6% | 96.2% |
| 1M+ | 19 | 3.8% | 100% |
| total | 503 | 100% |
March’s median sold price for houses and condos combined was $389,000 — a 6.1 percent increase over February’s median sold price of $366,585 for combined sales of houses and condos.
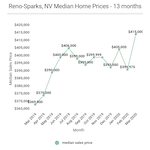
The table below contains the past 13 months of data[1]…
| Month Year | # Sold | Median Sold Price | Sold Price per Sq Ft | Median DOM | # of Actives | # of Pendings |
| Mar 2020 | 503 | $415,000 | $221.57 | 56 | 774 | 658 |
| Feb 2020 | 456 | $391,975 | $212.80 | 79 | 587 | 816 |
| Jan 2020 | 391 | $405,000 | $216.01 | 88 | 621 | 712 |
| Dec 2019 | 518 | $393,500 | $216.29 | 81 | 779 | 541 |
| Nov 2019 | 455 | $400,000 | $216.54 | 72 | 956 | 683 |
| Oct 2019 | 563 | $399,999 | $216.61 | 76 | 1,090 | 773 |
| Sep 2019 | 579 | $395,000 | $218.24 | 68 | 1,283 | 814 |
| Aug 2019 | 623 | $399,000 | $213.78 | 64 | 1,342 | 898 |
| Jul 2019 | 606 | $406,000 | $217.39 | 60 | 1,367 | 906 |
| Jun 2019 | 570 | $400,000 | $219.78 | 55 | 1,252 | 915 |
| May 2019 | 680 | $390,000 | $220.27 | 54 | 1,163 | 911 |
| Apr 2019 | 531 | $375,000 | $213.73 | 65 | 996 | 923 |
| Mar 2019 | 458 | $369,000 | $207.92 | 78 | 867 | 815 |
Thank you for taking the time to read this market report. As always, your comments and questions are welcomed.
1. The “Past 13 Months of Home Sales Data” table above is updated on a monthly basis. The median home price data reported covers the cities of Reno, Nevada and Sparks, Nevada [NNRMLS Area #100]. Residential data includes Site/Stick Built properties only. Data excludes Condo/Townhouse, Manufactured/Modular and Shared Ownership properties. Data courtesy of the Northern Nevada Regional MLS – April 7, 2020. Note: This information is deemed reliable, but not guaranteed.
For historical home sale data dating back to 1998 click here.
Click here to see Reno Homes for Sale.


JR
Guy, where do you see the market headed with the Pandemic recession soon to be upon us (i.e. already here)? The lower velocity of sales would be the first sign of a slowing market, so logically with wage destruction happening through mass layoffs and small business finances getting crushed, home prices should follow shortly. However, I also know that EDAWN has been touting for years the undersupply of available homes. Is it possible that home sales volume decreases, but prices remain flat, due to the undersupply of homes? Or is the undersupply mostly hype and we’re in for a sizable correction, considering as you outlined we just hit a record high again (i.e. much more downside risk than upside)? I would love to hear your thoughts / forecast on where you see the market headed!
Guy Johnson
Hi JR. Thank you for your comment and question.
We’re already seeing signs of the market slowing. Property showings have plummeted due to the stay-at-home order [and, as you know, it’s difficult to sell a house, if no one views it].
We’re also seeing many transactions fall out of escrow — due to a variety of reasons: Buyers no longer qualifying and losing financing; Buyers’ fears and uncertainties; etc.
For these reasons, we can expect units sales to be depressed. Our market typically sees over 500 houses sold during the month of April. It will be interesting to see if we hit even 400 sales this month.
Though the above may result in some price reductions, I don’t see a dramatic decrease in the median sales price…yet. Some flattening, likely.
I will be keeping an eye on it.
Thank you for reading the blog.
Guy Johnson
JR, As a follow-up to my previous reply, I thought you might find this analysis of interest: Is Reno’s Housing Market’s Slowing Down?
JR
Thank you Guy, sincerely appreciate the follow up & consideration!