
Reno-Sparks median sales price drops — Pending sales up substantially

May’s median sold home price for Reno-Sparks fell to $399,900 — a 3.8 percent decrease from April’s record-setting high.
Year-over-year, May’s median closed sales price is up 2.5 percent.
May’s median sold price per square foot (PPSF) increased — coming in at $222.30, or 1.1 percent up over April’s $219.95/sq.ft.
Year-over-year, May’s median sold PPSF is up 1.0 percent.
Homes Sold
Home sales rose to 403 units sold in May. And though this number is 3.3 percent higher than the number of homes sold in April, year-over-year, May’s home sales are off a whopping 40.9 percent from 682 homes sold in May 2019.
Inventory
Currently 720 homes are available for purchase in the Reno-Sparks market. This number is down 11.3 percent from the 812 homes available for sale this time last month. Year-over-year, current available inventory is down 38.1 percent.
Pending sales rose substantially in May. Presently, 1,048 homes are pending sale in the Reno-Sparks market. That number represents a 50.4 percent increase over the 697 homes pending sale this time last month.
Year-over-year, pending sales are up 15.0 percent.
Days on Market and Days to Contract
May’s median days on market (DOM) came in 57 days — an increase of 6 days over April’s median DOM. Year-over-year, May’s DOM number is up 3 days over May 2019’s number.
May’s median days to contract (DTC) came in at 5 days — an increase of 1 day over April’s median 4 DTC. Year-over-year, May’s DTC number is up 1 day over May 2019’s number.
Sales by Type
May sales by type, break out as follows:
- REO sales: 0.2% – down from April’s 1.3%
- Short sales: 0.2% – down from April’s 0.3%
- Subject to Court Approval sales: 2.0% – up over April’s 1.0%
- Relocation sales: 0.2% – down from April’s 0.8%
- Equity sales: 97.3% – up over April’s 96.6%
Sales by Price
May sales by price band, break out as follows in the table below…
| sales price ($000’s) | units sold | % of sales | cumulative % of sales |
| 0 – 99 | 0 | 0.0% | 0.0% |
| 100 – 199 | 1 | 0.2% | 0.2% |
| 200 – 299 | 43 | 10.7% | 10.9% |
| 300 – 399 | 159 | 39.5% | 50.4% |
| 400 – 499 | 105 | 26.1% | 76.4% |
| 500 – 599 | 46 | 11.4% | 87.8% |
| 600 – 699 | 16 | 4.0% | 91.8% |
| 700 – 799 | 9 | 2.2% | 94.0% |
| 800 – 899 | 5 | 1.2% | 95.3% |
| 900 – 999 | 4 | 1.0% | 96.3% |
| 1M+ | 15 | 3.7% | 100% |
| total | 403 | 100% |
May’s median sold price for houses and condos combined was $385,500 — a 3.6 percent decrease from April’s median sold price of $400,000 for combined sales of houses and condos.
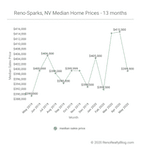
The table below contains the past 13 months of data[1]…
| Month Year | # Sold | Median Sold Price | Sold Price per Sq Ft | Median DOM | # of Actives | # of Pendings |
| May 2020 | 403 | $399,900 | $222.30 | 57 | 720 | 1,048 |
| Apr 2020 | 390 | $415,500 | $219.95 | 51 | 812 | 697 |
| Mar 2020 | 513 | $415,000 | $221.31 | 56 | 774 | 658 |
| Feb 2020 | 459 | $392,500 | $211.63 | 78 | 587 | 816 |
| Jan 2020 | 393 | $405,000 | $216.01 | 88 | 621 | 712 |
| Dec 2019 | 518 | $393,500 | $216.29 | 81 | 779 | 541 |
| Nov 2019 | 455 | $400,000 | $216.54 | 72 | 956 | 683 |
| Oct 2019 | 563 | $399,999 | $216.61 | 76 | 1,090 | 773 |
| Sep 2019 | 579 | $395,000 | $218.24 | 68 | 1,283 | 814 |
| Aug 2019 | 623 | $399,000 | $213.78 | 64 | 1,342 | 898 |
| Jul 2019 | 606 | $406,000 | $217.39 | 60 | 1,367 | 906 |
| Jun 2019 | 570 | $400,000 | $219.78 | 55 | 1,252 | 915 |
| May 2019 | 682 | $390,000 | $220.13 | 54 | 1,163 | 911 |
Thank you for taking the time to read this market report. As always, your comments and questions are welcomed.
1. The “Past 13 Months of Home Sales Data” table above is updated on a monthly basis. The median home price data reported covers the cities of Reno, Nevada and Sparks, Nevada [NNRMLS Area #100]. Residential data includes Site/Stick Built properties only. Data excludes Condo/Townhouse, Manufactured/Modular and Shared Ownership properties. Data courtesy of the Northern Nevada Regional MLS – May 19, 2020. Note: This information is deemed reliable, but not guaranteed.
For historical home sale data dating back to 1998 click here.
Click here to see Reno Homes for Sale.


