
The Carson City housing market mixed steady pricing with selective momentum in October 2025. Single-family home prices pushed higher, while condos saw softer price points but a pickup in closings. Days on market improved for condos and held near seasonal norms for SFRs as sellers continued to trim asking prices to meet buyers.
Highlights
Single-Family Homes
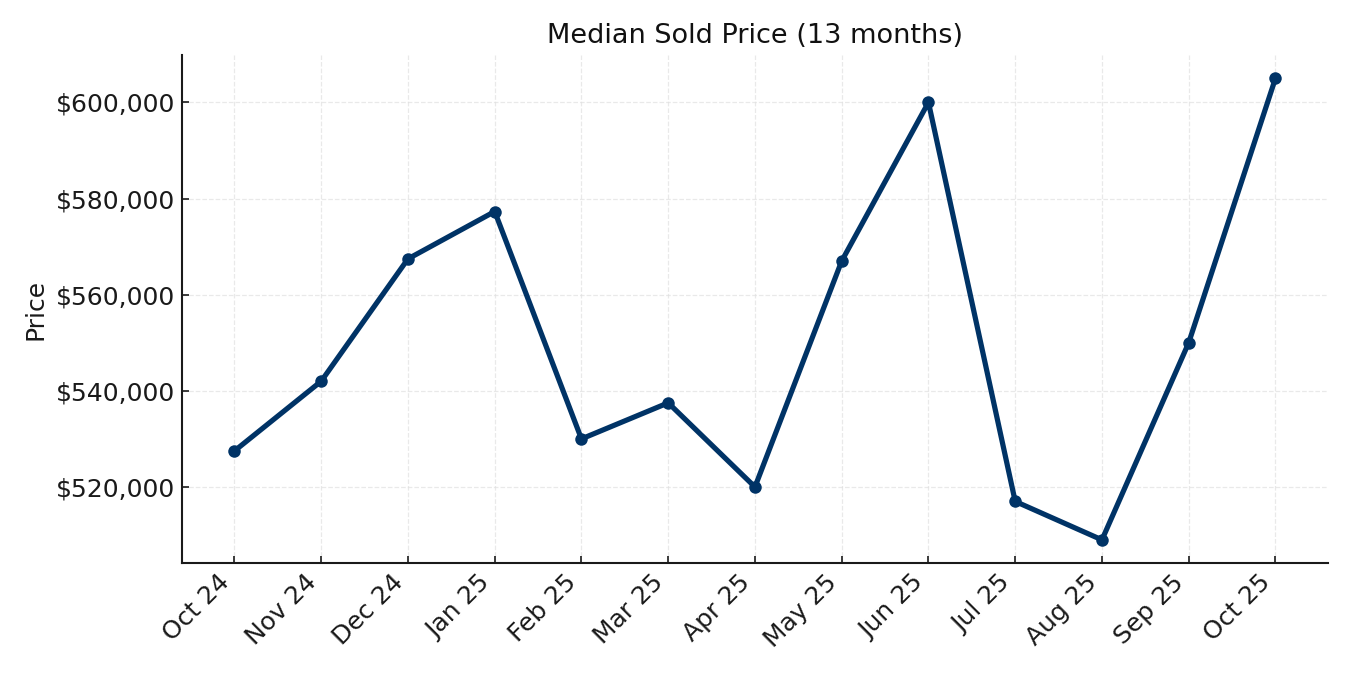
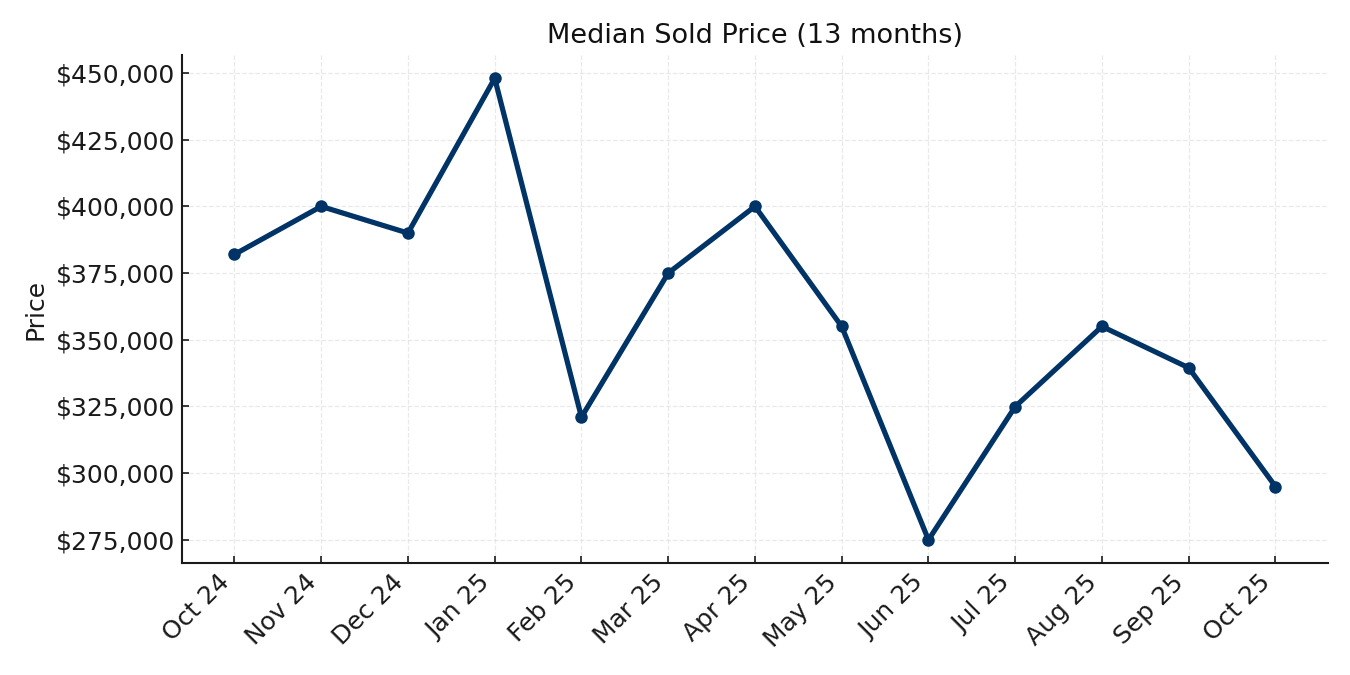
- Median Sold Price: $605,000 (+10.0% MoM · +14.7% YoY)
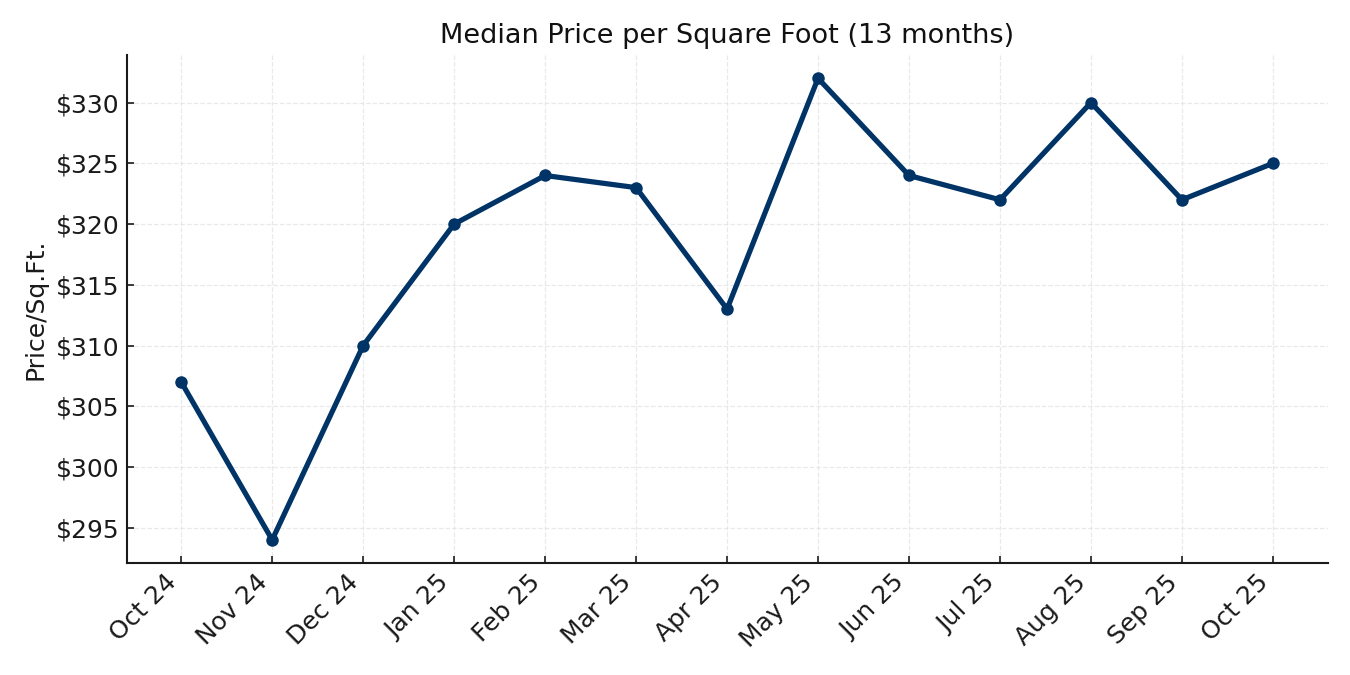
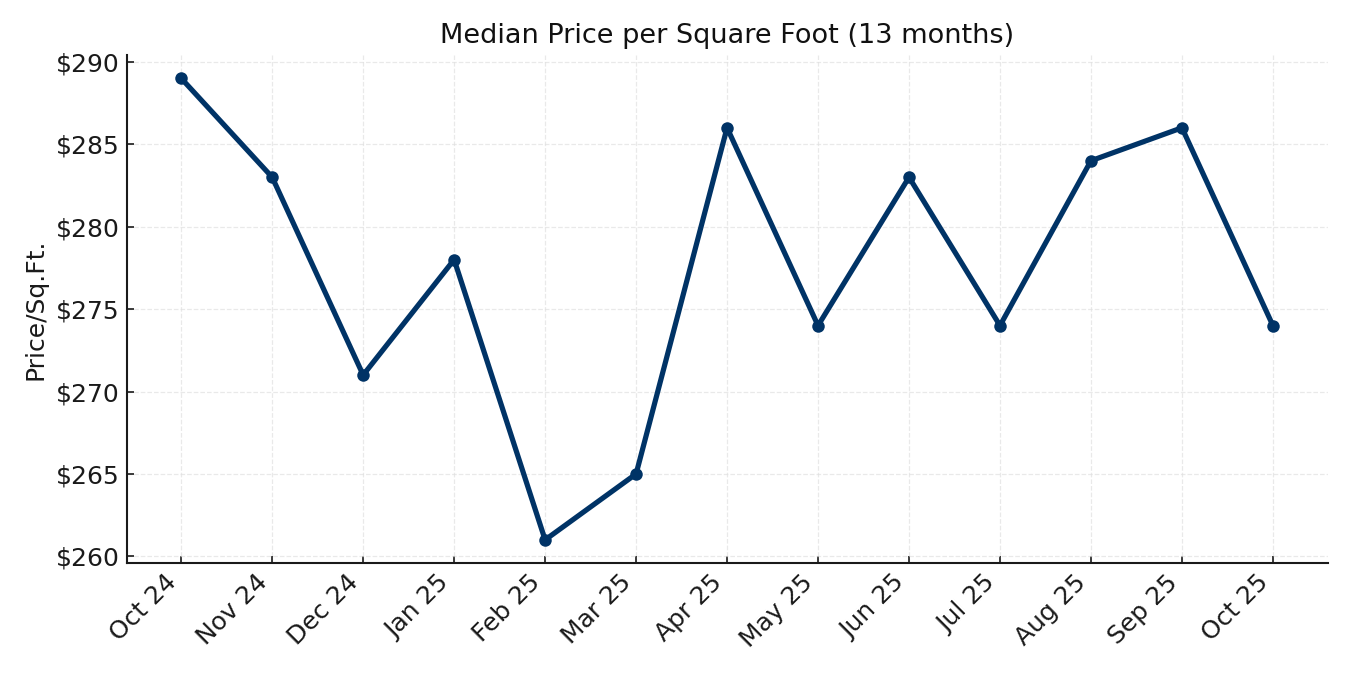
- Median Price per Sq. Ft.: $325 (+0.9% MoM · +5.9% YoY)
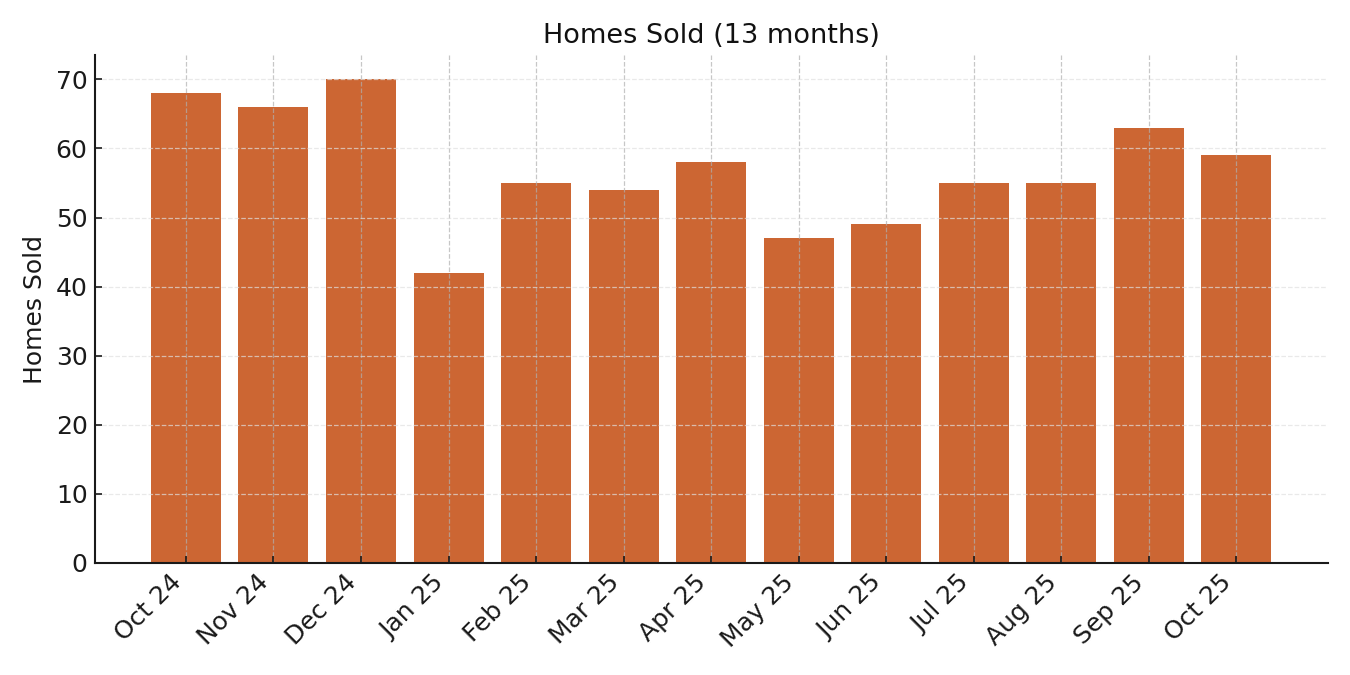
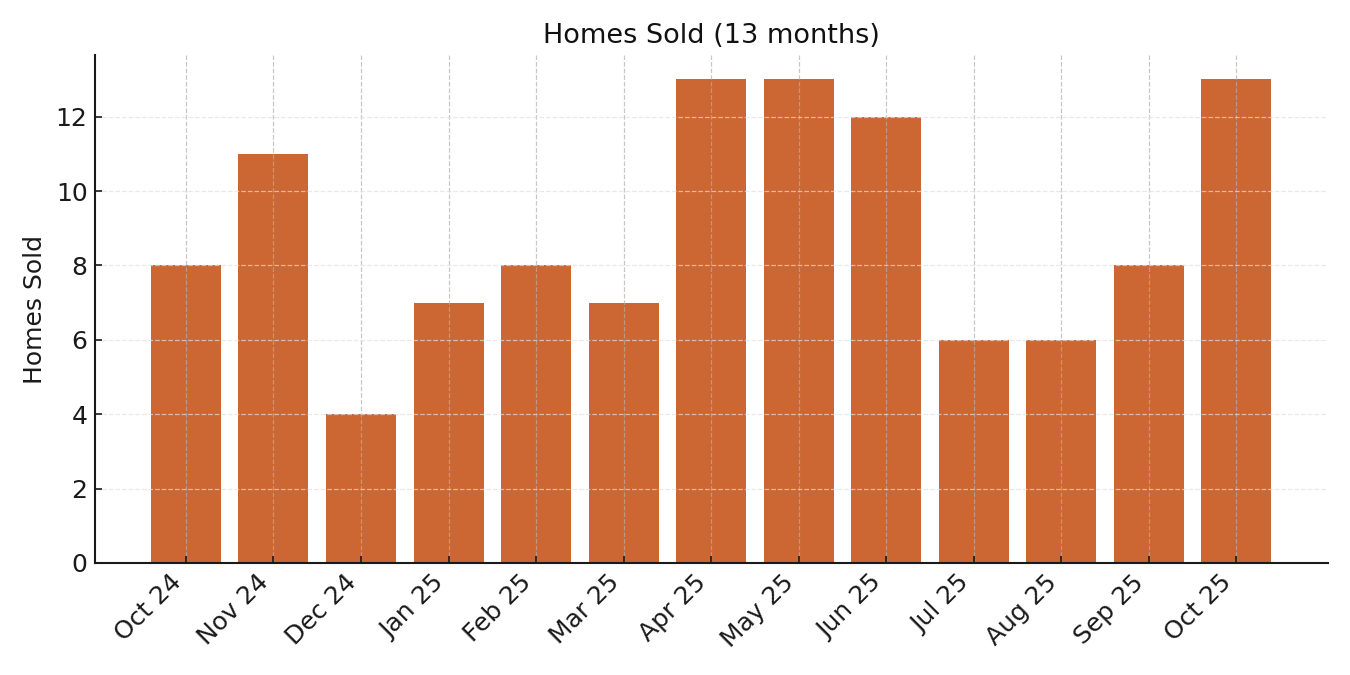
- Homes Sold: 59 (-6.3% MoM · -13.2% YoY)
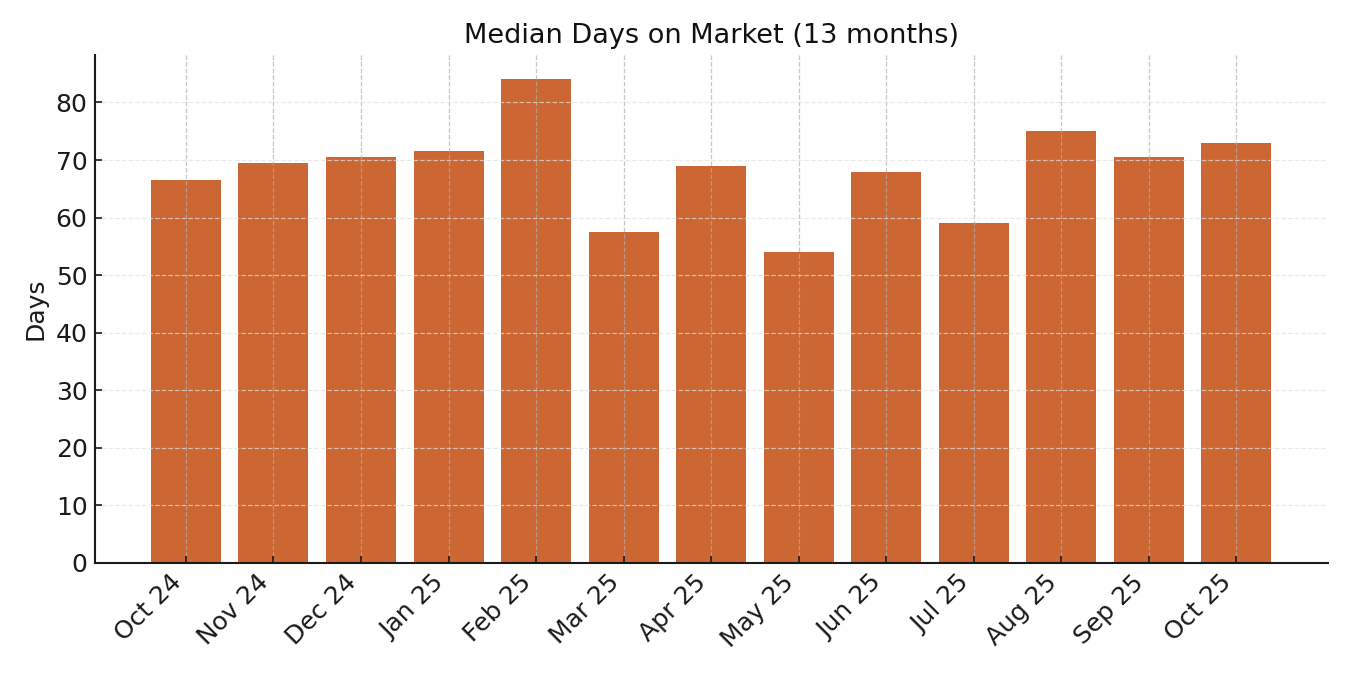
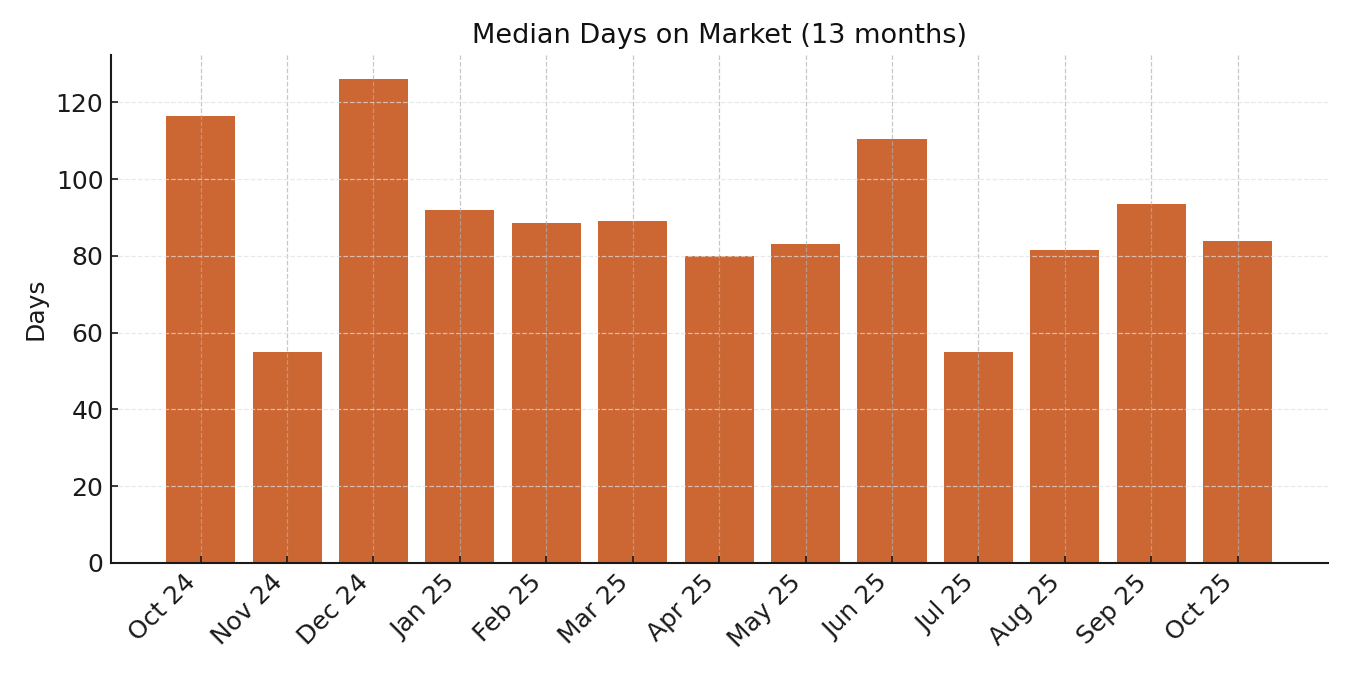
- Median Days on Market: 73 days (+3.6% MoM · +9.8% YoY)
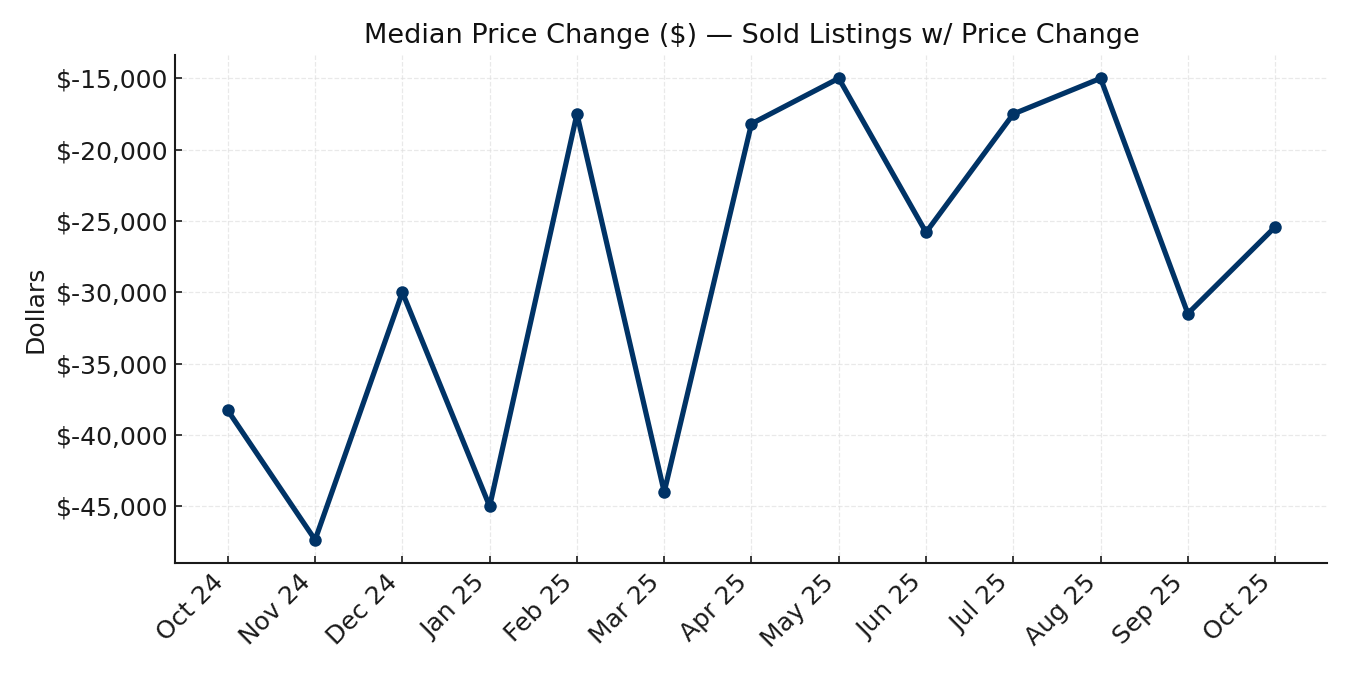
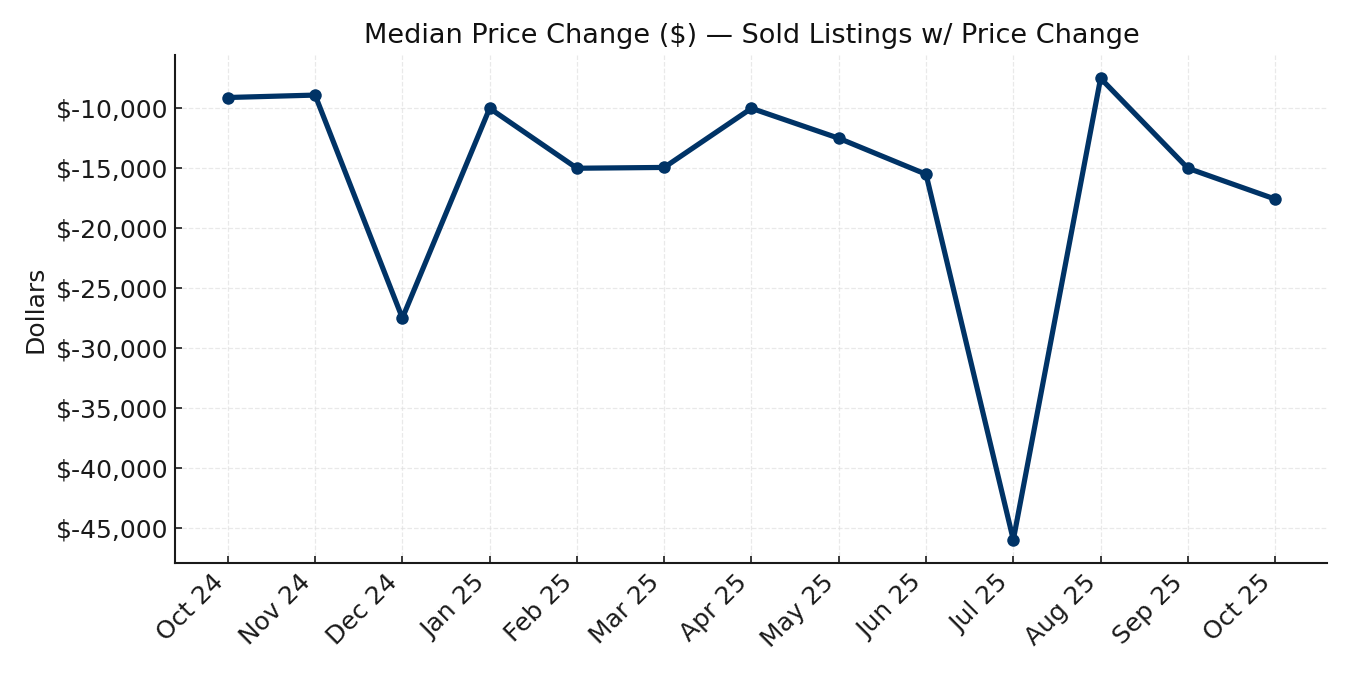
- Price Adjustments: 28 sold listings had reductions (47.5%), median change -$25,418 (-4.1%)
Condos & Townhomes
- Median Sold Price: $295,000 (-13.1% MoM · -22.8% YoY)
- Median Price per Sq. Ft.: $274 (-4.2% MoM · -5.2% YoY)
- Units Sold: 13 (+62.5% MoM · +62.5% YoY)
- Median Days on Market: 84 days (-10.2% MoM · -27.9% YoY)
- Price Adjustments: 8 sold listings had reductions (61.5%), median change -$17,575 (-5.6%)
Carson City Single-Family Homes
Pricing remained firm. The median sold price rose to $605,000 (+10.0% MoM; +14.7% YoY) and the median PPSF edged up to $325 (+0.9% MoM; +5.9% YoY). Closings totaled 59 (-6.3% MoM; -13.2% YoY) as seasonality set in. Median DOM ticked to 73 days (+3.6% MoM; +9.8% YoY). Sellers continued to use reductions: 28 sold listings had a price change with a median adjustment of -$25,418.
Carson City Condos/Townhomes
Attached homes traded at lower price points, but activity improved. The median sold price came in at $295,000 (-13.1% MoM; -22.8% YoY) with PPSF at $274 (-4.2% MoM; -5.2% YoY). Closings rose to 13 (+62.5% MoM; +62.5% YoY) and median DOM improved to 84 days (-10.2% MoM; -27.9% YoY). 8 sold listings reflected reductions with a median change of -$17,575.
What this means
Buyers: More approachable price points in condos and selective SFR opportunities where sellers have adjusted pricing. Move quickly on well-priced, updated homes.
Sellers: Price to the market and present well. Strategic reductions are still unlocking buyer engagement, particularly before the winter slowdown.
Additional Insights
Regional demand remains bifurcated: updated SFRs in move-in condition are drawing stronger offers, while value-focused buyers gravitate toward the condo and townhome segment. Recent rate stability has improved buyer engagement on well-priced listings, but affordability still dictates pace — precise pricing is key.
Data courtesy of the Northern Nevada Regional MLS. Data is deemed reliable but not guaranteed. Analysis performed by Guy Johnson, REALTOR®, Keller Williams Group One, Inc.