
The Incline Village and Crystal Bay market finished November with a familiar late-year pattern: buyers stayed selective, and well-priced homes still found traction. At the same time, inventory levels kept the overall pace from feeling “fast.” As a result, sellers who leaned into realistic pricing tended to do better than those testing the top of the market.
Incline Village / Crystal Bay Single-Family Homes
Key Stats – November 2025 (MoM & YoY)
| Metric | November 2025 | MoM | YoY |
|---|---|---|---|
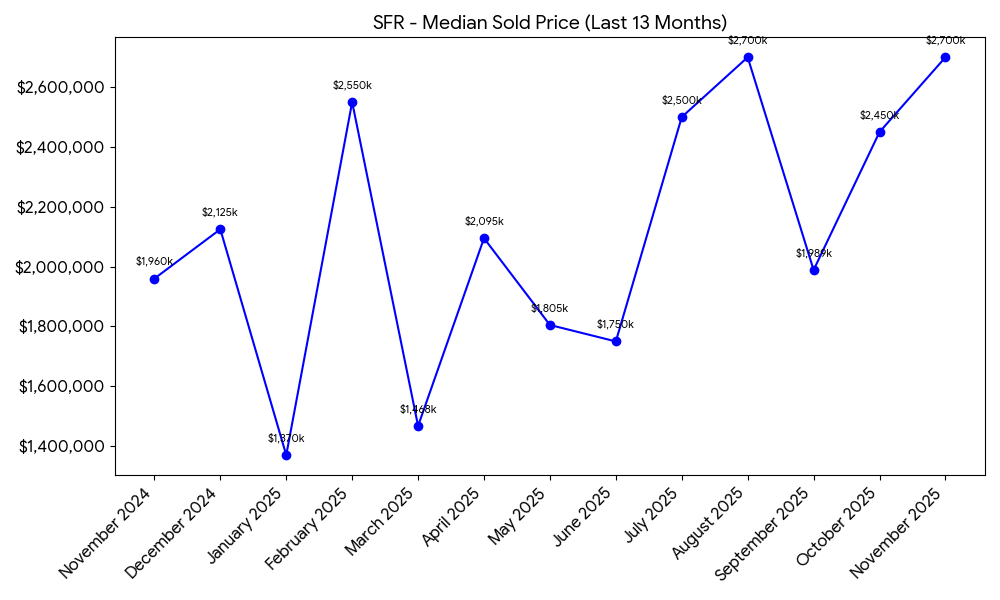
| Median Sold Price | $2,700,000 | +10.2% | +37.8% |
| Median Sold Price / Sq Ft | $975.57 | +4.3% | +21.1% |
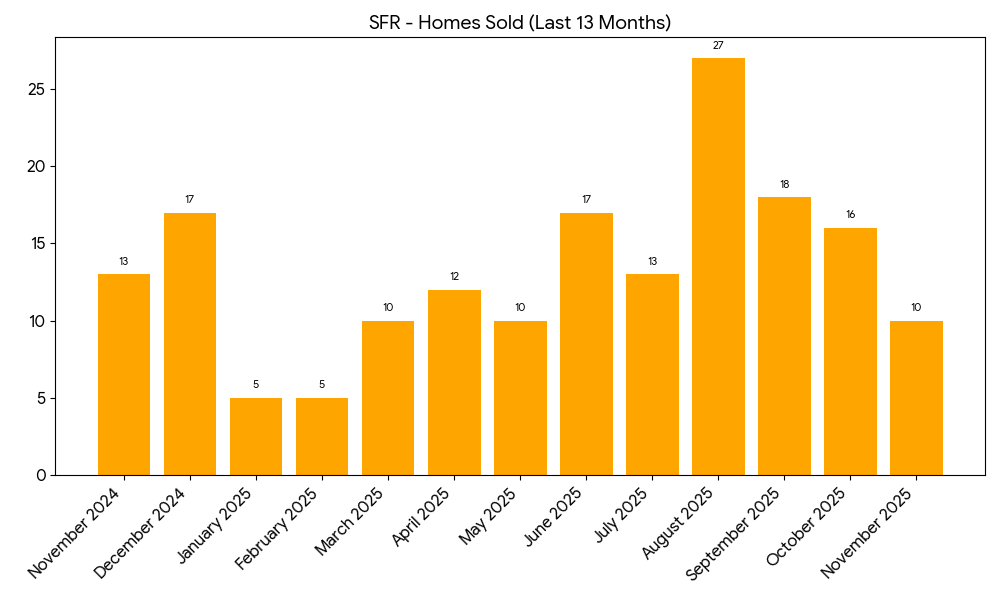
| Homes Sold | 10 | -37.5% | -23.1% |
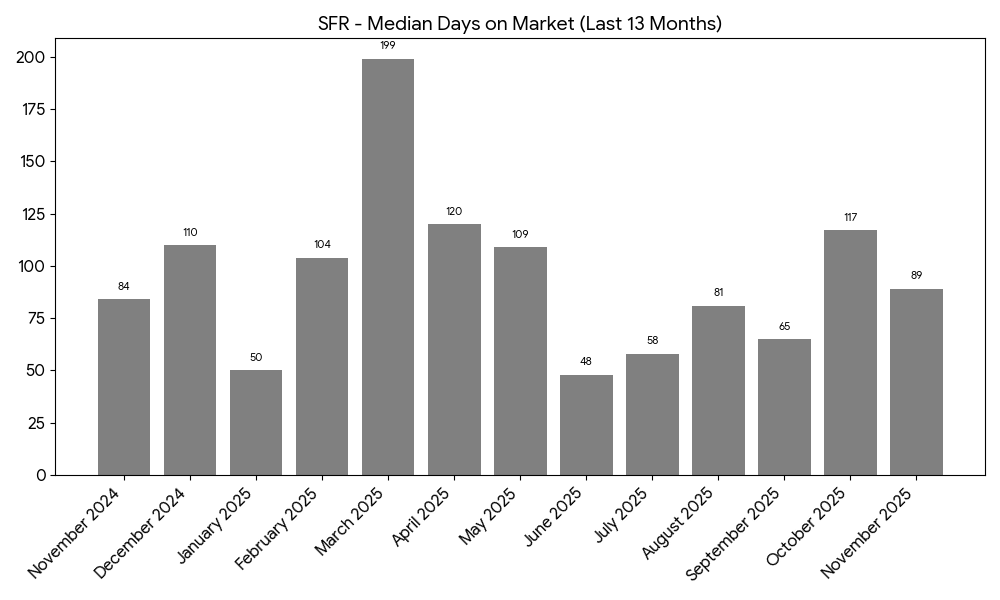
| Median Days on Market | 89 | -23.9% | +6.0% |
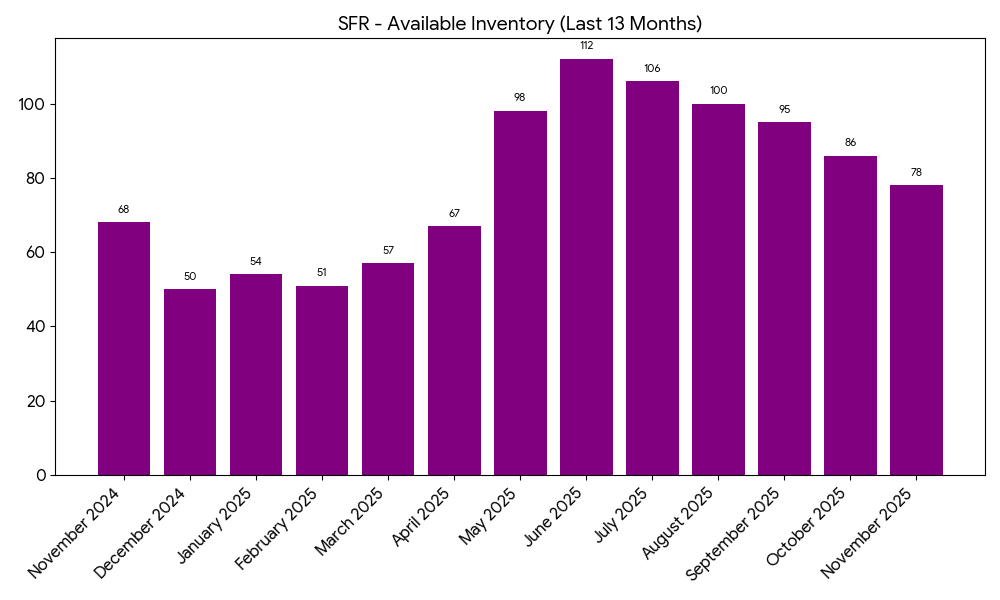
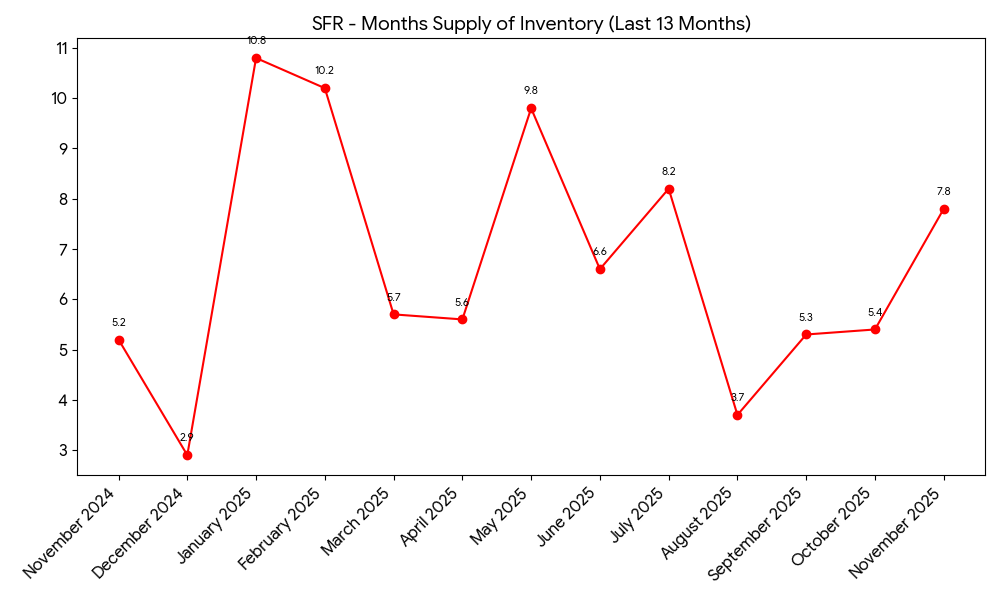
| Months Supply of Inventory (MSI) | 7.8 | +44.4% | +50.0% |
Note: MoM compares October 2025 to November 2025. YoY compares November 2024 to November 2025. Figures reflect the most recent 13 months (from November 2024 through November 2025).
Single-family prices moved higher in November. The median sold price rose +10.2% from last month and is up +37.8% year-over-year. Meanwhile, the median price per square foot climbed +4.3% month-over-month, which suggests buyers were still willing to pay for quality finishes and strong locations.
Even so, the pace cooled on the transaction side. Closings dipped to 10 for the month, down -37.5% from October. Inventory also stayed elevated, pushing MSI up to 7.8 months — a level that usually rewards prepared buyers and disciplined sellers.
Seller Pricing & Reductions
- Pricing adjustments were common: in 92% of the last 13 months, the median sold price came in below the median list price.
- Typical reduction size: the median discount over the last 13 months was about $145,250.
- This month’s gap: the median sold price was about $152,500 below the median list price (roughly 5.3%), with a median sold-to-list ratio of 94.7%.
Single-Family Charts

Incline Village / Crystal Bay Condos & Townhomes
Key Stats – November 2025 (MoM & YoY)
| Metric | November 2025 | MoM | YoY |
|---|---|---|---|
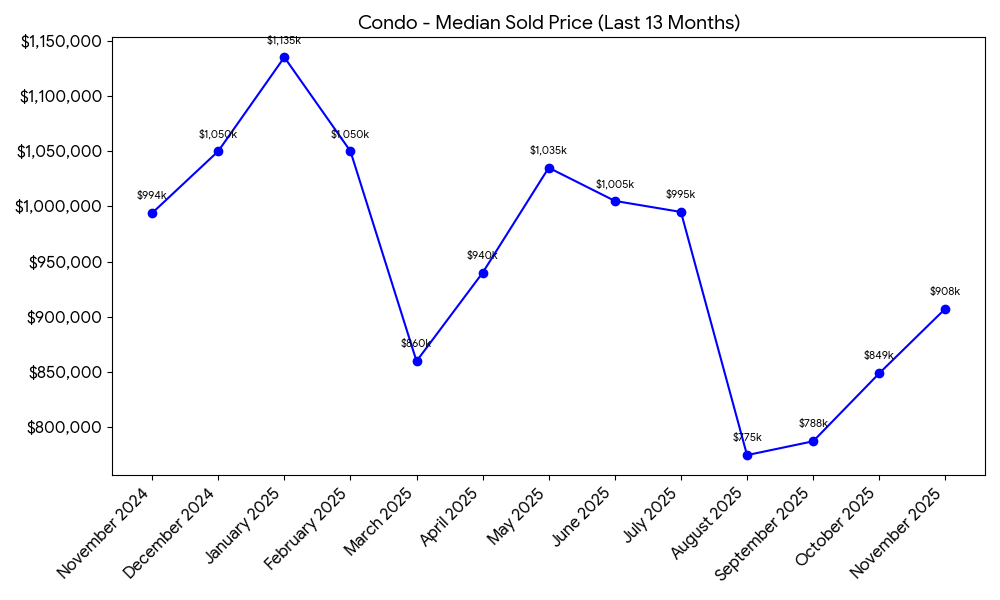
| Median Sold Price | $907,500 | +6.9% | -8.7% |
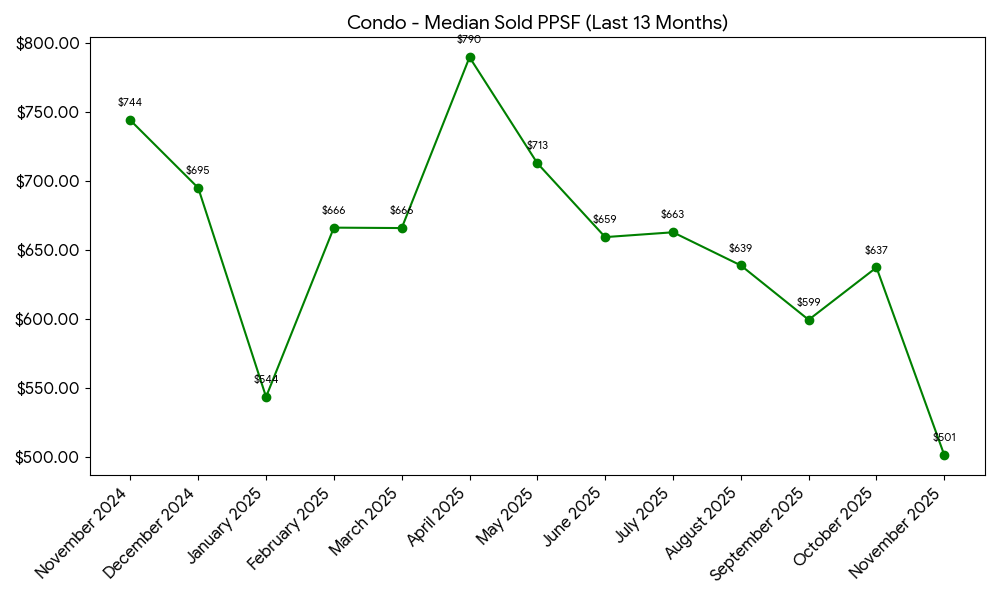
| Median Sold Price / Sq Ft | $501.41 | -21.3% | -32.6% |
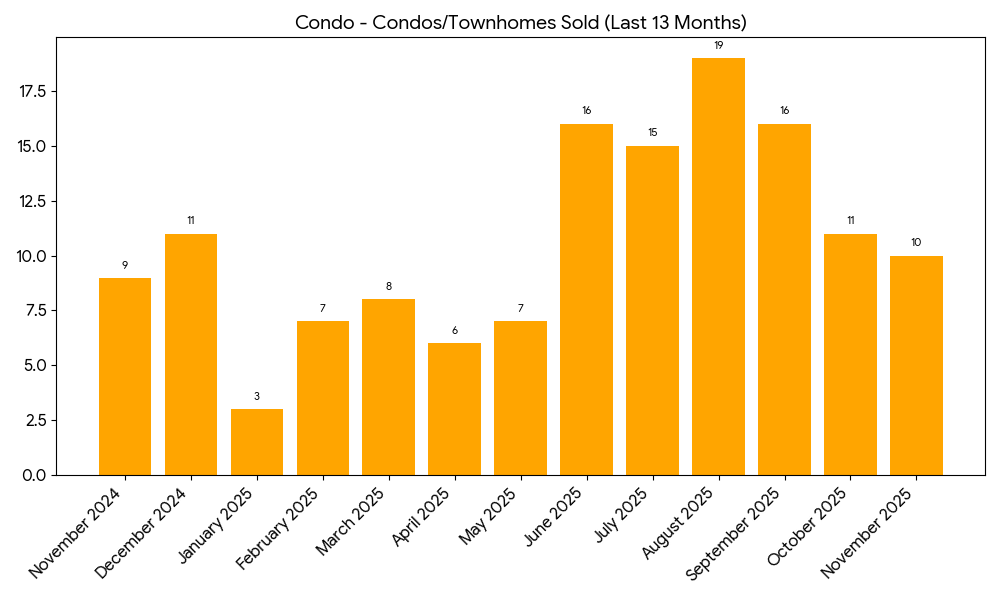
| Condos/Townhomes Sold | 10 | -9.1% | +11.1% |
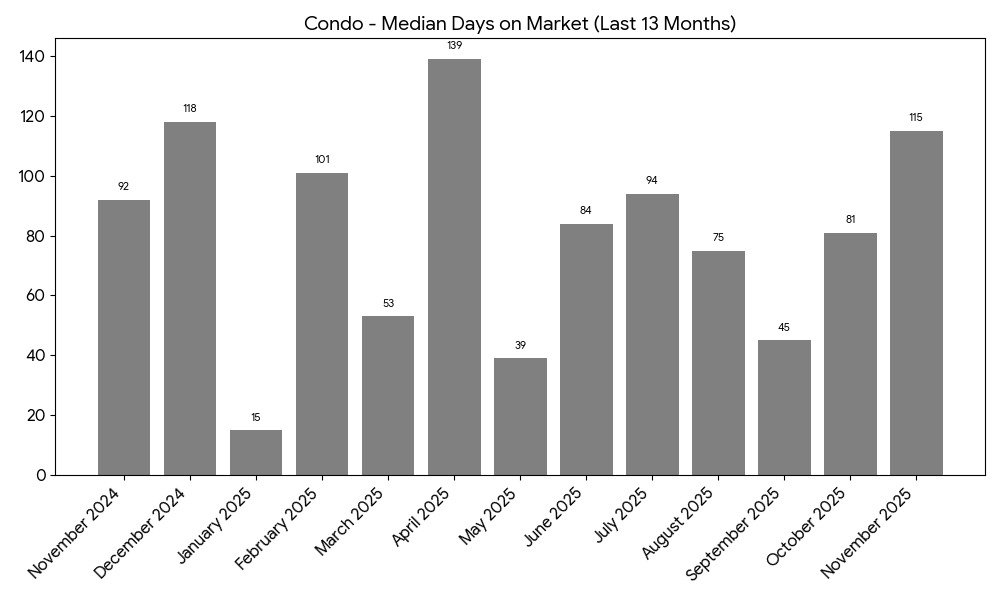
| Median Days on Market | 115 | +42.0% | +25.0% |
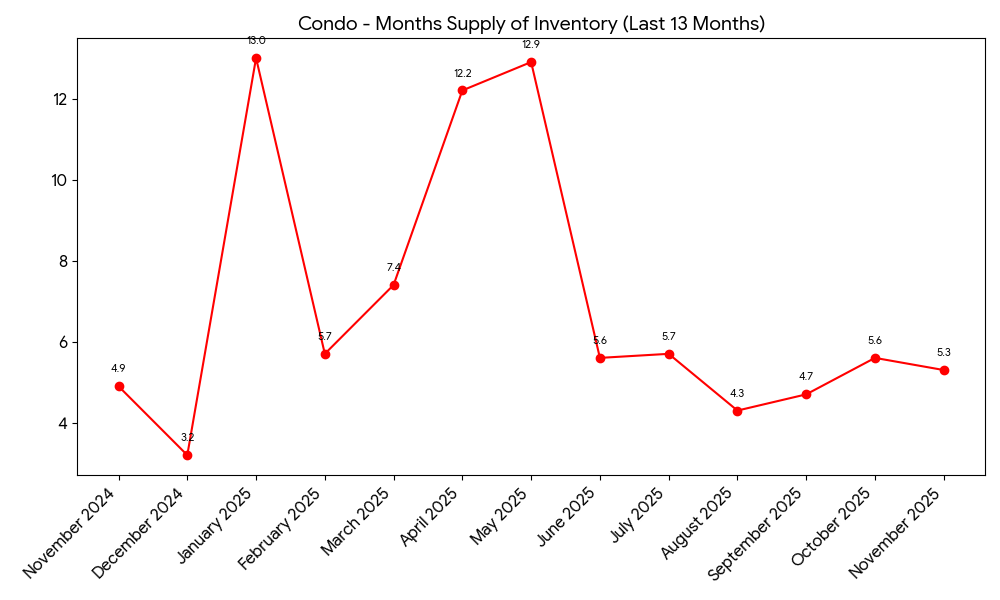
| Months Supply of Inventory (MSI) | 5.3 | -5.4% | +8.2% |
Note: MoM compares October 2025 to November 2025. YoY compares November 2024 to November 2025. Figures reflect the most recent 13 months (from November 2024 through November 2025).
The condo/townhome segment told a more mixed story in November. The median sold price increased +6.9% from October, yet it remains -8.7% compared to a year ago. At the same time, the median price per square foot declined month-over-month, which can happen when the month’s sales skew toward larger homes, older finishes, or a different complex mix.
Activity also softened on the volume side. Sales held at 10 for the month, while median days on market stretched to 115. Still, MSI stayed near 5.3 months, so the attached market continues to look “balanced-ish,” depending on price point and amenities.
Seller Pricing & Reductions
- Pricing adjustments were still frequent: in 69% of the last 13 months, the median sold price landed below the median list price.
- Typical reduction size: the median discount over the last 13 months was about $45,000.
- This month’s gap: the median sold price was about $41,500 below the median list price (roughly 4.4%), with a median sold-to-list ratio of 95.6%.
Condo/Townhome Charts

Closing Summary
Taken together, November showed a market that is still moving, but not rushing. Single-family pricing strengthened even as sales volume eased, while condos/townhomes posted a smaller price lift month-over-month with softer year-over-year comps. Going into winter, condition, location, and presentation should matter even more — and the homes that feel “turnkey” tend to stand out first.
Data courtesy of the Incline Village REALTORS®. Data is deemed reliable but not guaranteed.