
Here is our Carson City real estate market report for July 2026 — a data-driven look at home prices, sales, inventory, and market speed across the region.
Browse our past Carson City market reports.
Market Snapshot (SFRs and Condo/Townhomes)
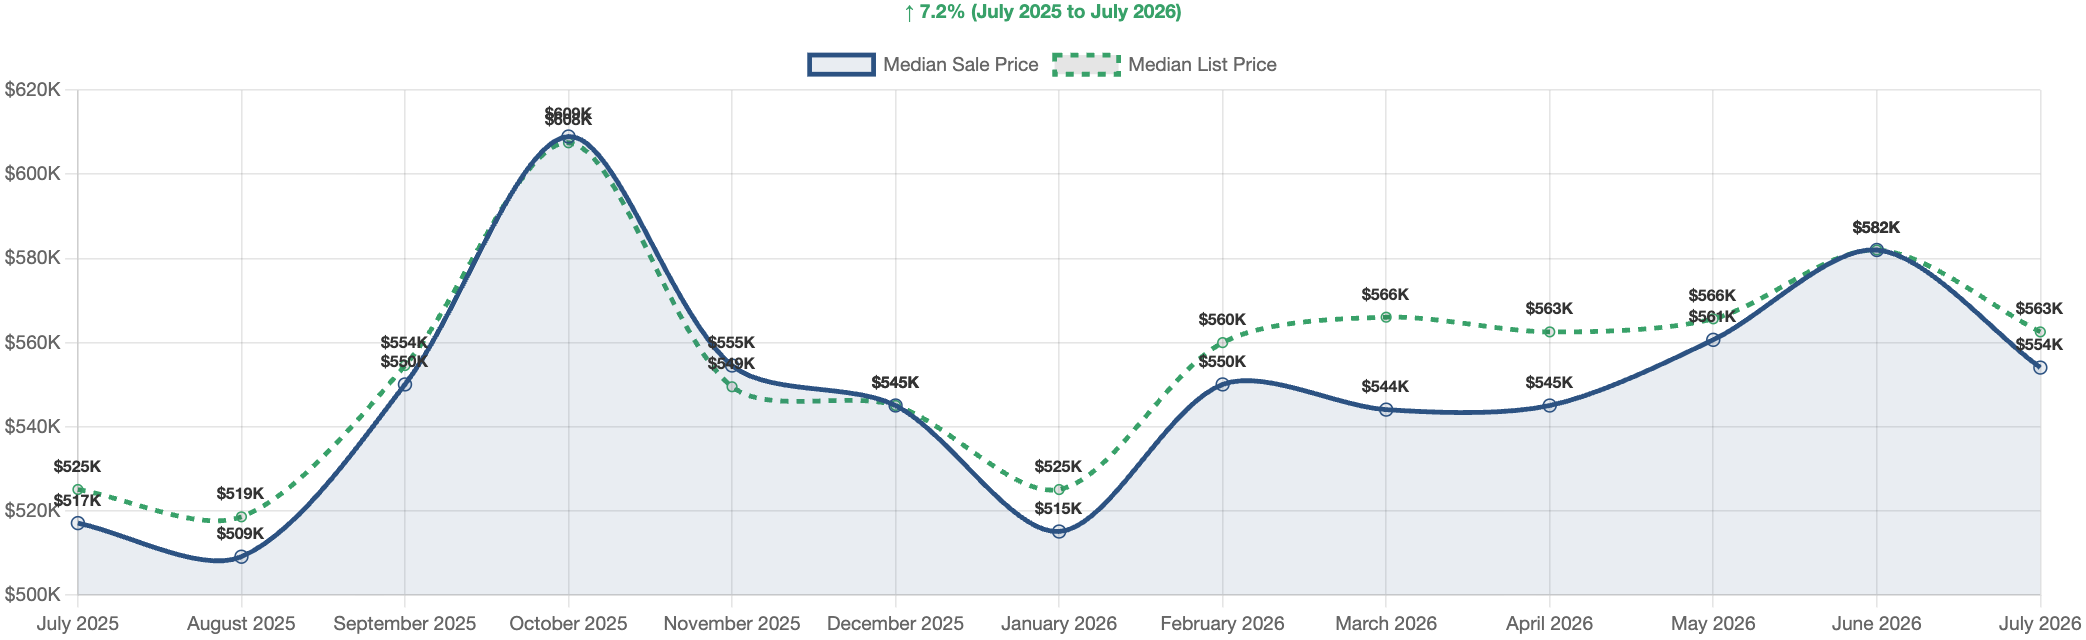
Carson City’s housing market delivered a split story in July 2026 — single family home prices are up 7.2% year over year, yet the overall median sale price dipped 10.2% month over month, signaling a month of mixed signals worth unpacking. Even so, with just 1.9 months of supply across all property types, this market remains firmly in seller’s territory. Buyers and sellers alike should pay close attention to what the data is telling us this month.
🏠 Single Family Residences
Pricing and Sales Volume
The headline story for single family homes in July 2026 is a strong year-over-year price gain paired with a short-term dip. The median sale price came in at $554,000, which is up 7.2% compared to July 2025. However, that same price is down 4.8% from June 2026, suggesting some cooling at the top after a busy spring season. In total, 70 homes closed during the month, generating $43,337,344 in sales volume. That said, closed sales dropped 19.5% from June, so fewer deals crossed the finish line. Still, year over year, closed sales are up a strong 27.3%, which shows the market has grown meaningfully over the past twelve months.
Inventory and Market Speed
Sellers remain in the driver’s seat when it comes to inventory. There are currently 126 active single family listings and 92 pending sales, leaving just 1.8 months of supply — a very low number that favors sellers. Meanwhile, the months of supply jumped 25.9% from last month, which is worth watching. Homes are taking a median of 55.5 days to sell overall, but buyers are moving faster than that number suggests — the median days to contract was just 19.5 days. In addition, 84 new listings came to market in July, which keeps the pipeline moving but has not yet created enough inventory to shift the balance toward buyers.
Price Reductions and Seller Behavior
Not every seller is getting their asking price on the first try. About 30% of single family homes that sold in July had at least one price cut before going under contract. For those sellers, the median reduction was 2.9%, or about $20,000. On the other hand, homes that sold were still very close to their original asking price overall — the sold-to-original-list ratio came in at a solid 98.8%. That means most sellers are pricing well and getting near full value. Cash buyers also played a notable role, making up 30.0% of all closed sales, which adds a layer of competition for financed buyers.
What This Means for SFR Buyers and Sellers
For sellers, the data is encouraging. Year-over-year price growth of 7.2% and a sold-to-list ratio of 98.8% show that well-priced homes are still commanding strong offers. However, the month-over-month dip in both price and sales volume is a reminder that overpricing can cost you time and money. For buyers, the low 1.8 months of supply means competition is real. Because of this, being pre-approved and ready to move quickly — ideally within that 19.5-day window before a contract is signed — gives you the best shot at landing a home. In short, this is still a seller’s market, but smart pricing and preparation matter more than ever on both sides.
SFR Sales by Price Range
| Price Range | Sales | % of Total |
|---|---|---|
| Over $1M | 6 | 8.6% |
| $750K-$1M | 8 | 11.4% |
| $600K-$750K | 13 | 18.6% |
| $500K-$600K | 18 | 25.7% |
| $400K-$500K | 21 | 30.0% |
| $300K-$400K | 3 | 4.3% |
| Under $300K | 1 | 1.4% |
🏢 Condos & Townhomes
Pricing and Sales Activity
The condo and townhome segment turned in one of its most active months in recent memory. Closed sales jumped 150.0% year over year, with 15 units closing in July for a total volume of 5,112,900. That is a striking number, and it points to growing demand in this more affordable price tier. The median sale price landed at $375,000, which is up 15.4% year over year — the strongest annual price gain of any segment this month. However, the month-over-month picture shows a modest pullback of 3.8% from June. Similarly, the 25.0% increase in closed sales from last month shows buyers are actively engaging with this segment even as prices soften slightly in the short term.
Inventory and Time on Market
Inventory in the condo market is tighter than it looks on the surface. There are 35 active listings and 24 pending sales, resulting in 2.3 months of supply. That said, months of supply dropped sharply — down 48.2% year over year — which shows how dramatically the balance has shifted toward sellers over the past year. In contrast to single family homes, condos are taking noticeably longer to sell. The median days on market was 70 days, and the median days to contract was 42 days — more than double the 19.5-day figure for single family homes. Furthermore, days on market jumped 40.0% from June, suggesting that while demand is growing, buyers in this segment are being more selective or deliberate in their decisions.
Price Reductions and Seller Expectations
Price reductions are more common in the condo market than in single family homes, and that gap is meaningful. Specifically, 40.0% of condos and townhomes that sold in July had a price cut before going under contract — compared to 30.0% for single family homes. The median reduction was 3.7%, or about $12,525. On top of that, the sold-to-original-list ratio came in at just 96.6%, well below the 98.8% seen in the SFR market. This tells us that condo sellers who price aggressively from day one are more likely to face a reduction. As a result, pricing strategy matters even more in this segment.
What This Means for Condo Buyers and Sellers
For buyers, the condo and townhome market offers a meaningful opportunity. The median price of $375,000 is well below the $554,000 median for single family homes, making this segment an accessible entry point into Carson City homeownership. Beyond that, the longer days on market — 70 days versus 55.5 days for single family — means buyers may have slightly more time and negotiating room. For sellers, the 15.4% year-over-year price gain is a strong sign of growing value in this category. However, with 40% of sales requiring a price cut, coming in at a realistic asking price from the start will lead to a faster, smoother sale. Overall, the condo market is gaining momentum, and that trend looks likely to continue heading into fall.
Condo/Townhome Sales by Price Range
| Price Range | Sales | % of Total |
|---|---|---|
| Over $1M | 0 | 0.0% |
| $750K-$1M | 0 | 0.0% |
| $600K-$750K | 0 | 0.0% |
| $500K-$600K | 0 | 0.0% |
| $400K-$500K | 4 | 26.7% |
| $300K-$400K | 6 | 40.0% |
| Under $300K | 5 | 33.3% |
Financing Breakdown (All Properties)
| Loan Type | Sales | % of Total |
|---|---|---|
| Conventional | 48 | 56.5% |
| Cash | 25 | 29.4% |
| FHA | 8 | 9.4% |
| VA | 3 | 3.5% |
| Other | 1 | 1.2% |
Carson City Real Estate Market Outlook – July 2026
Carson City’s housing market in July 2026 remains a seller’s market by any standard measure. With just 1.9 months of overall supply, there simply are not enough homes to meet demand, and that dynamic is keeping prices firm even as short-term month-over-month numbers fluctuate. Single family homes offer strong annual price growth and lightning-fast contract timelines, while condos and townhomes are emerging as a high-growth, more affordable alternative with impressive year-over-year gains. Looking ahead, buyers should stay ready to act fast, sellers should price with precision to avoid unnecessary reductions, and investors should take note of the 15.4% annual price appreciation in the condo segment. The bottom line: in Carson City right now, the market rewards preparation, patience, and realistic expectations on both sides of the table.
Thanks for reading our Carson City real estate market report for July 2026. We publish these updates monthly.
Have Questions About the Carson City Market?
Whether you are considering buying, selling, or simply trying to understand how current market conditions affect your home’s value, local data matters.
For a data-driven look at your specific neighborhood or property type, contact Guy Johnson, REALTOR® with Keller Williams Group One, Inc.
Guy Johnson, REALTOR®
Keller Williams Group One, Inc.
NV Lic. # S.75262.LLC
Phone: (775) 722-4011
Email: guyjohnson@kw.com