
Here is our Reno/Sparks real estate market report for August 2026 — a data-driven look at home prices, sales, inventory, and market speed across the region.
Browse our past Reno/Sparks market reports.
Market Snapshot (SFRs and Condo/Townhomes)
The Reno/Sparks housing market cooled its pace in August 2026, with closed sales dropping 17.8% from July to 480 homes. Even so, prices held firm, as the overall median sale price rose 1.0% for the month and 3.6% from a year ago to reach $575,000. With just 2.4 months of supply, sellers still hold the upper hand — but buyers gained a little breathing room this month.
🏠 Single Family Residences
Prices Hold Strong Despite Slower Sales
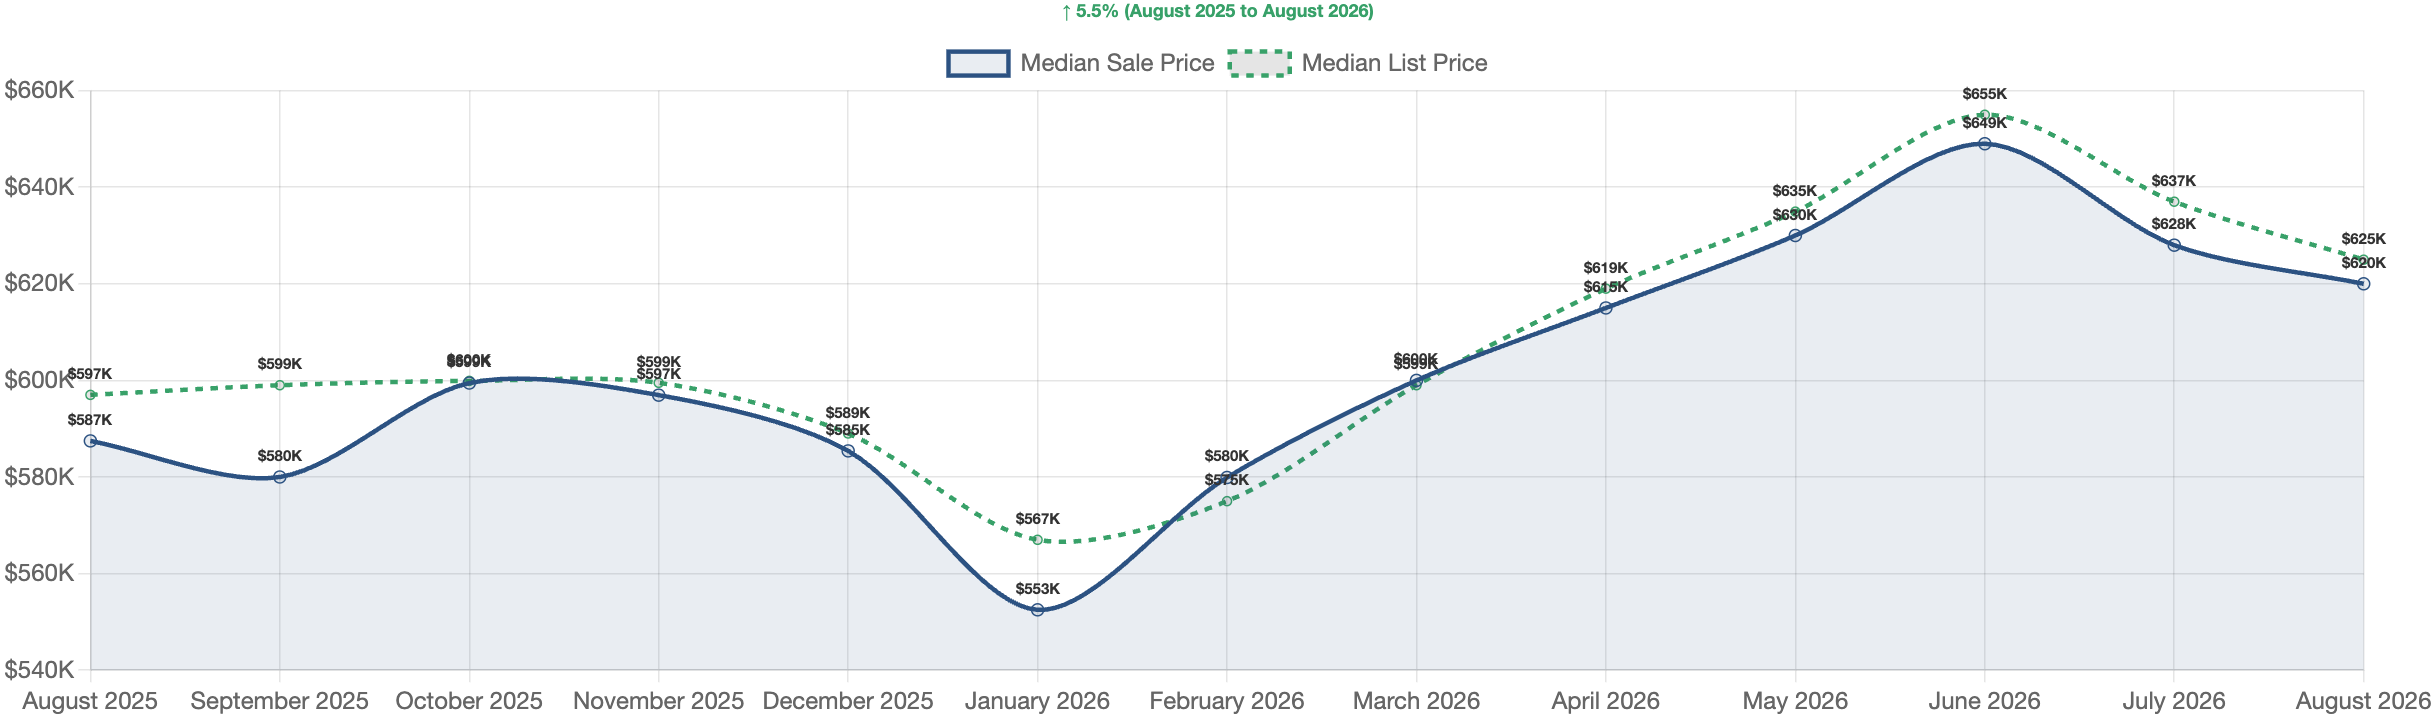
The big story for single family homes this month is a slowdown in sales paired with steady prices. Specifically, 386 homes closed in August, down 17.2% from July and 2.0% from last year. Still, the median sale price landed at $620,000, up a healthy 5.5% from a year ago. That said, prices did slip 1.3% from July, so the month-to-month picture is a bit softer. Total sales volume reached $306,268,711, and homes sold at a median of $336.65 per square foot. Overall, sellers received 98.8% of their original asking price, which shows buyers are still paying close to full price.
Market Timing and Seller Activity
Homes are taking a little longer to sell than they did in July. The median days on market rose 16.7% to 56 days, yet that figure is still 9.7% faster than a year ago. More importantly, homes went under contract in a median of just 21.0 days, so well-priced listings are moving fast. Meanwhile, sellers stayed active, bringing 431 new listings to market. Because of this, buyers had more fresh choices even as overall sales slowed. On top of that, 491 homes sat pending at month’s end, which points to solid closings ahead.
Inventory and Price Cuts
Active listings stood at 889 homes, giving the market 2.3 months of supply. To put it simply, that keeps single family homes in seller’s market territory, since anything under three months favors sellers. However, supply did jump 23.0% from July, even though it remains 12.5% below last year. In addition, about 32.1% of sellers cut their price before selling, with a median cut of $23,250, or 3.7%. That tells us pricing right from the start matters more than ever.
What This Means for Buyers and Sellers
For sellers, the market is still on your side, but the days of naming any price are over. Consequently, homes priced at true market value are going under contract in about three weeks. On the flip side, buyers now see more listings, slightly longer market times, and one in three sellers cutting prices. As a result, there is more room to negotiate than there was earlier this year — especially on homes that have been sitting.
SFR Sales by Price Range
| Price Range | Sales | % of Total |
|---|---|---|
| Over $1M | 59 | 15.3% |
| $750K-$1M | 67 | 17.4% |
| $600K-$750K | 81 | 21.0% |
| $500K-$600K | 95 | 24.6% |
| $400K-$500K | 66 | 17.1% |
| $300K-$400K | 16 | 4.1% |
| Under $300K | 2 | 0.5% |
🏢 Condos & Townhomes
Prices Surge in the Condo Market
Condos and townhomes turned in the strongest price gains in the whole market this month. Notably, the median sale price jumped 6.0% from July and 10.6% from a year ago, landing at $370,490. In contrast, single family prices dipped slightly month over month, so the condo segment is clearly running hotter on price. Buyers closed on 94 condos and townhomes, adding up to $36,821,965 in total volume. Even though that sales count fell 20.3% from July, it still sits 34.3% above last August. Sellers received 98.5% of their original asking price, at a median of $289.50 per square foot.
Timing, Listings, and Inventory
Condos took a median of 56 days to sell, nearly flat from July and 12.5% faster than a year ago. Similarly, homes went under contract in a median of 24.0 days — just a few days slower than single family homes. Meanwhile, sellers listed 117 new condos and townhomes, keeping fresh choices flowing to buyers. Active listings reached 248 units, with 93 pending at month’s end. Because of this, months of supply climbed 38.2% from July to 2.6 months. Even so, that is 41.2% lower than last year, so inventory remains tight by any long-term measure.
Price Cuts and Cash Buyers
Price cuts hit 34.0% of condo sales, slightly more than the single family rate. However, the cuts were smaller in dollar terms, with a median reduction of $15,000, or 3.5%. Beyond that, one stat really stands out: 36.2% of condo sales were all cash, far above the 22.8% cash rate for single family homes. In short, investors and downsizers with cash are playing a big role in this segment.
What This Means for Condo Buyers and Sellers
For sellers, double-digit yearly price growth and strong demand make this a great time to list. On the other hand, buyers face rising prices and stiff competition from cash offers. Therefore, financed buyers should get fully pre-approved and be ready to move fast. With that in mind, condos remain the most affordable path into this market at roughly $250,000 less than the median single family home.
Condo/Townhome Sales by Price Range
| Price Range | Sales | % of Total |
|---|---|---|
| Over $1M | 2 | 2.1% |
| $750K-$1M | 2 | 2.1% |
| $600K-$750K | 4 | 4.3% |
| $500K-$600K | 10 | 10.6% |
| $400K-$500K | 23 | 24.5% |
| $300K-$400K | 22 | 23.4% |
| Under $300K | 31 | 33.0% |
Financing Breakdown (All Properties)
| Loan Type | Sales | % of Total |
|---|---|---|
| Conventional | 259 | 54.0% |
| Cash | 122 | 25.4% |
| FHA | 58 | 12.1% |
| VA | 32 | 6.7% |
| Private | 4 | 0.8% |
| Seller Financed | 3 | 0.6% |
| Assumed | 1 | 0.2% |
| Other | 1 | 0.2% |
Sales by City
| City | Sales | Median Price |
|---|---|---|
| Reno | 334 | $608,225 |
| Sparks | 146 | $549,495 |
Reno/Sparks Real Estate Market Outlook – August 2026
Overall, the Reno/Sparks market is easing off the gas without hitting the brakes. With 2.4 months of supply market-wide, sellers still hold the advantage, though rising inventory and slower sales suggest the market is slowly moving toward balance. Looking ahead, sellers should price sharply from day one, since roughly a third of listings now need a price cut to sell. Meanwhile, buyers can expect more choices and a bit more negotiating power this fall. For investors, the condo segment’s 10.6% yearly price growth and heavy cash activity make it the one to watch. In short, this is a market rewarding patience for buyers and precision for sellers — and those who understand that shift will come out ahead.
Thanks for reading our Reno/Sparks real estate market report for August 2026. We publish these updates monthly.
Have Questions About the Reno/Sparks Market?
Whether you are considering buying, selling, or simply trying to understand how current market conditions affect your home’s value, local data matters.
For a data-driven look at your specific neighborhood or property type, contact Guy Johnson, REALTOR® with Keller Williams Group One, Inc.
Guy Johnson, REALTOR®
Keller Williams Group One, Inc.
NV Lic. # S.75262.LLC
Phone: (775) 722-4011
Email: guyjohnson@kw.com