
Here is our Carson City real estate market report for August 2026 — a data-driven look at home prices, sales, inventory, and market speed across the region.
Browse our past Carson City market reports.
Market Snapshot (SFRs and Condo/Townhomes)
Carson City’s housing market stayed hot in August 2026, with 82 homes sold and a median price of $516,000 — up 4.2% from a year ago. Notably, sales jumped 34.4% year-over-year while supply tightened to just 1.9 months, keeping sellers firmly in the driver’s seat. At the same time, condos and townhomes stole the show with a stunning 216.7% jump in yearly sales.
🏠 Single Family Residences
Prices Climb to New Heights
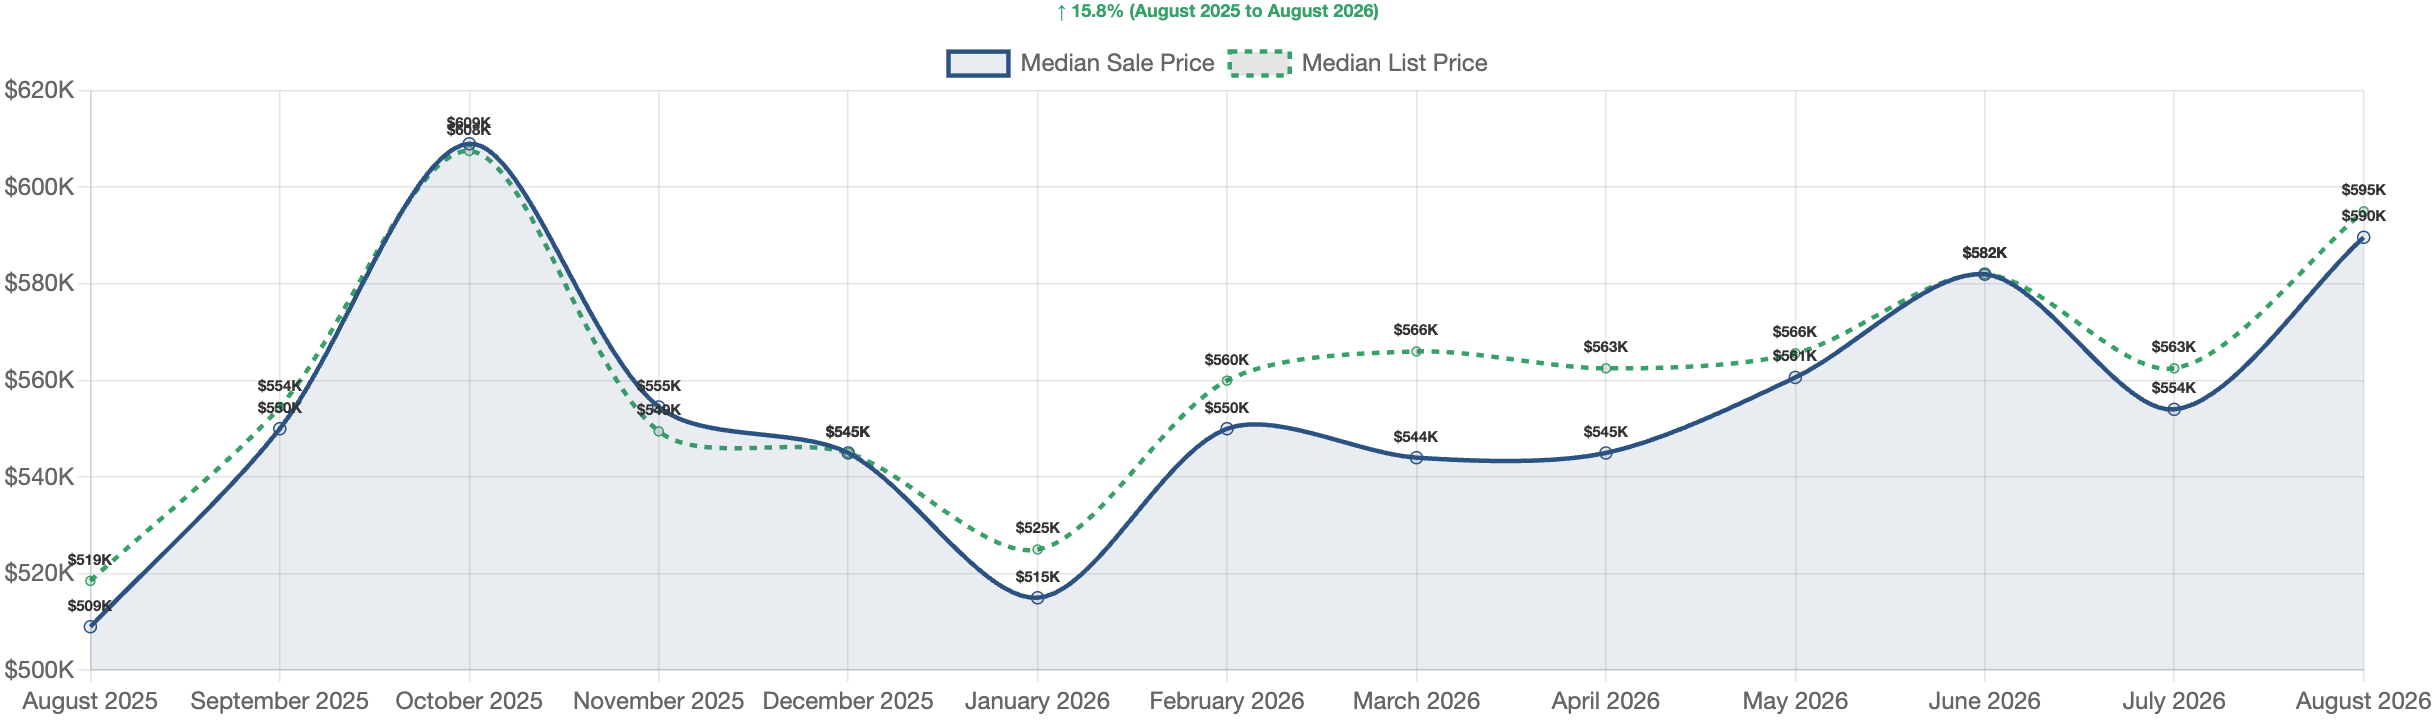
The big story for single family homes this month is price growth. The median sale price hit $589,630 in August, a jump of 6.4% from July and a striking 15.8% gain over last year. On top of that, homes sold at a median of $333.55 per square foot, and sellers captured 98.7% of their original asking price. In short, sellers who priced their homes well got close to full value.
Sales Volume and Market Speed
Buyers closed on 63 single family homes, adding up to $39,339,614 in total sales. That said, closed sales dipped -10.0% from July, though they still ran 14.5% ahead of last August. Meanwhile, homes moved fast. The median time to an accepted offer was just 18.5 days, and the median days on market fell to 54 — down -28.0% from a year ago. Because of this, well-priced homes are finding buyers in under three weeks.
Listings, Inventory, and Price Cuts
Sellers brought 75 new listings to market, a healthy sign that owners see this as a good time to sell. Even so, inventory stayed tight with 122 active listings and 90 homes pending. Months of supply held at 1.9, which points to a strong seller’s market. However, not every seller nailed their price. Specifically, 34.9% of sales needed a price cut before selling, with a median reduction of $17,500, or about 3.2%.
What It Means for Buyers and Sellers
For sellers, the math is simple: low supply plus fast sales equals leverage. Still, that one-in-three price cut rate shows buyers won’t overpay. On the other hand, buyers face rising prices and stiff competition, so quick decisions and strong offers matter. With that in mind, cash buyers — who made up 23.8% of sales — hold a real edge in this market.
SFR Sales by Price Range
| Price Range | Sales | % of Total |
|---|---|---|
| Over $1M | 4 | 6.3% |
| $750K-$1M | 8 | 12.7% |
| $600K-$750K | 18 | 28.6% |
| $500K-$600K | 14 | 22.2% |
| $400K-$500K | 15 | 23.8% |
| $300K-$400K | 4 | 6.3% |
| Under $300K | 0 | 0.0% |
🏢 Condos & Townhomes
Sales Surge in the Condo Market
Condos and townhomes were the surprise star this August. Closed sales hit 19 units, up 26.7% from July and an eye-popping 216.7% above last year. As a result, total sales volume reached $7,433,515. Clearly, buyers priced out of single family homes are turning to condos as a more affordable path to ownership.
Pricing and Market Timing
The median condo price landed at $393,990, up 5.1% from last month and 11.0% year-over-year. At $254.09 per square foot, condos cost far less than single family homes at $333.55. Meanwhile, market timing improved sharply. Median days on market dropped to 56, a -20.0% fall from July, and the median time to contract was 24.0 days. Similarly, sellers earned 98.2% of their original asking price.
Tight Supply and More Price Cuts
Only 18 new listings hit the market, barely keeping pace with the 19 sales. Consequently, active listings sit at just 31 units with 19 pending, and months of supply fell to 1.6 — down -65.1% from a year ago. That said, price cuts tell a different story here. Notably, 52.6% of condo sales needed a reduction before selling, far more than the 34.9% seen with single family homes. However, the cuts were small, with a median of $12,450, or 2.9%.
Takeaways for Condo Buyers and Sellers
For buyers, condos offer real value in this market, and financing is the norm since only 10.5% of sales were cash. On the flip side, sellers should price carefully from day one, since more than half of sales required a cut. Even so, with supply this tight, priced-right condos are moving fast and gaining value.
Condo/Townhome Sales by Price Range
| Price Range | Sales | % of Total |
|---|---|---|
| Over $1M | 0 | 0.0% |
| $750K-$1M | 0 | 0.0% |
| $600K-$750K | 0 | 0.0% |
| $500K-$600K | 2 | 10.5% |
| $400K-$500K | 6 | 31.6% |
| $300K-$400K | 8 | 42.1% |
| Under $300K | 3 | 15.8% |
Financing Breakdown (All Properties)
| Loan Type | Sales | % of Total |
|---|---|---|
| Conventional | 41 | 50.0% |
| FHA | 18 | 22.0% |
| Cash | 17 | 20.7% |
| VA | 4 | 4.9% |
| Other | 1 | 1.2% |
| Assumed | 1 | 1.2% |
Carson City Real Estate Market Outlook – August 2026
Overall, Carson City remains a clear seller’s market, with just 1.9 months of supply overall and even tighter conditions at 1.6 months for condos. Prices are climbing in both segments, homes are going under contract in about three weeks, and yearly sales are up sharply. Looking ahead, sellers should act while inventory stays lean, but they need to price sharply — nearly 39.0% of all sales required a price cut. For buyers, waiting could mean paying more later, so getting pre-approved and moving fast is the smart play. Furthermore, investors should watch the condo segment, where soaring demand and shrinking supply signal room to grow. In short, Carson City’s market rewards those who act with speed and price with honesty.
Thanks for reading our Carson City real estate market report for August 2026. We publish these updates monthly.
Have Questions About the Carson City Market?
Whether you are considering buying, selling, or simply trying to understand how current market conditions affect your home’s value, local data matters.
For a data-driven look at your specific neighborhood or property type, contact Guy Johnson, REALTOR® with Keller Williams Group One, Inc.
Guy Johnson, REALTOR®
Keller Williams Group One, Inc.
NV Lic. # S.75262.LLC
Phone: (775) 722-4011
Email: guyjohnson@kw.com