
Data: NNRMLS via FlexMLS as of October 13, 2025.
Key Metrics (Single-Family Homes, Carson City)
- Closed Sales: 63 (↑ 14.5% MoM, ↑ 6.8% YoY)
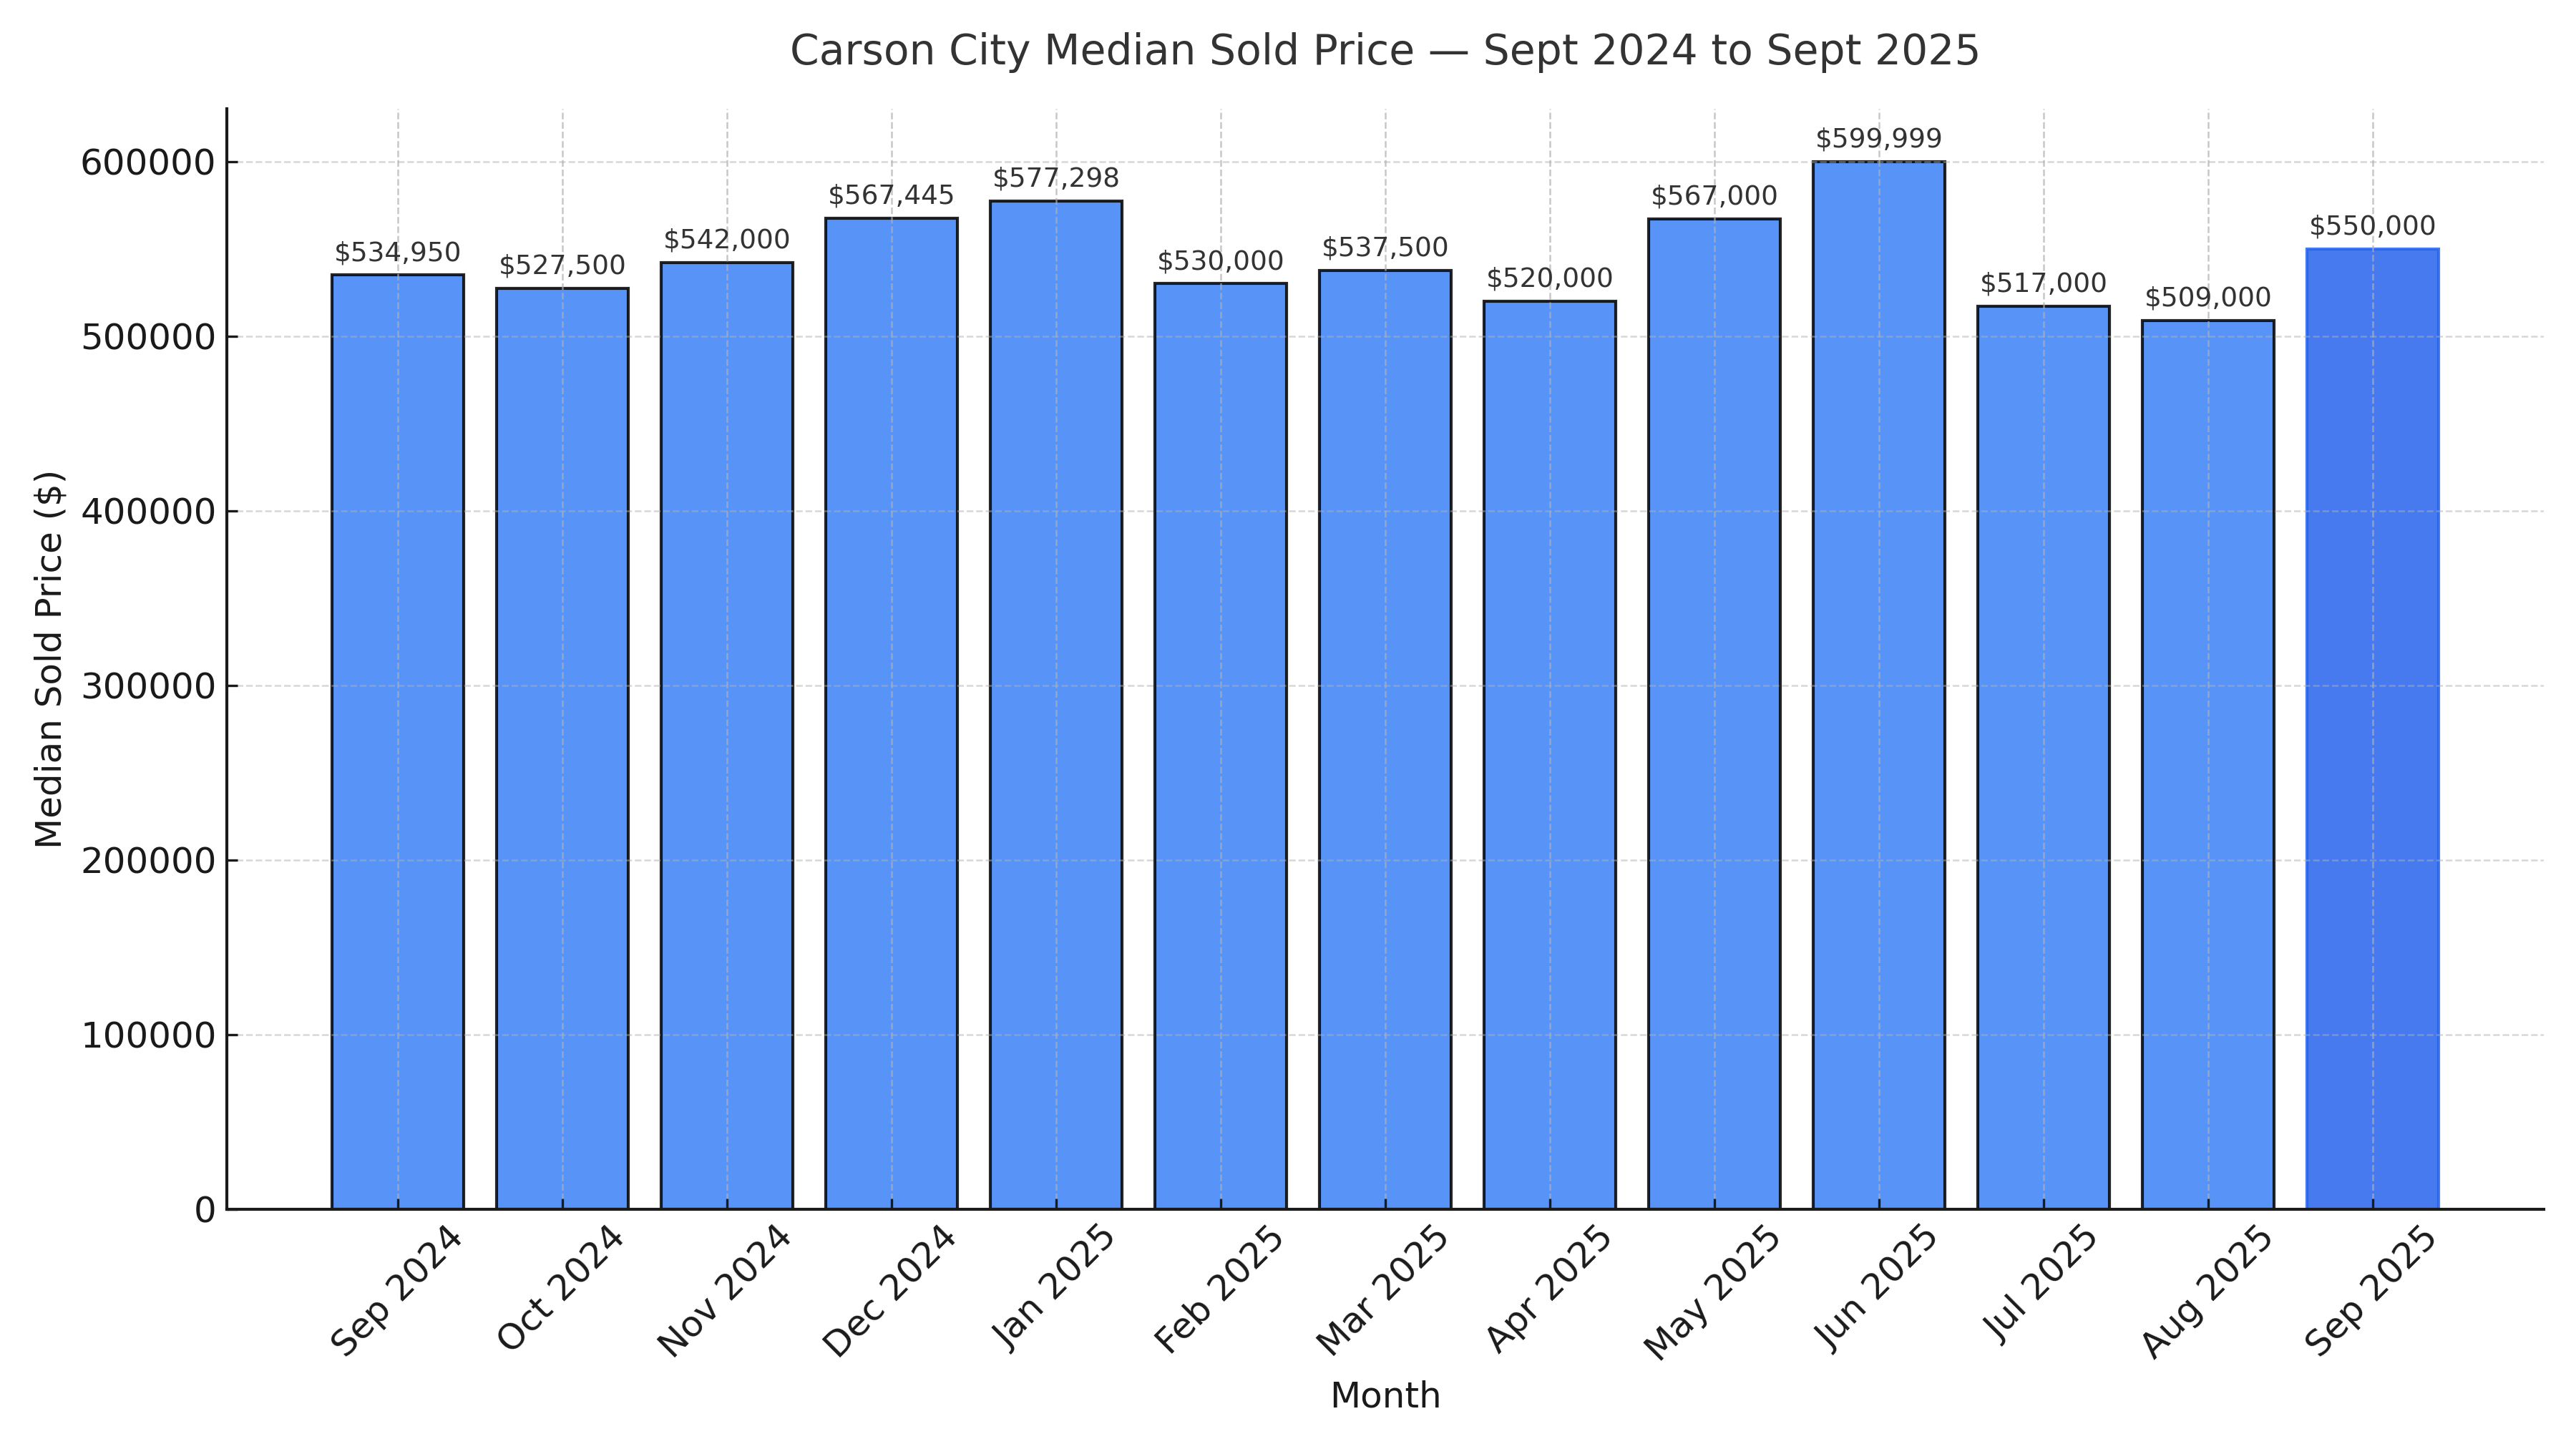
- Median Sales Price: $550,000 (↑ 8.1% MoM, ↑ 2.8% YoY)
- Median Price per Sq.Ft.: $324 (↓ 1.8% MoM, ↑ 10.2% YoY)
- Median Days on Market: 70 (↓ 6.7% MoM, ↑ 1.4% YoY)
- Active Inventory: 133 (↑ 17.7% MoM, ↓ 10.1% YoY)
- New Listings: 56 (↓ 21.6% MoM, ↓ 14.9% YoY)
- List-to-Sold Price Ratio: 98.9% (↑ 0.8% MoM, ↓ 1.1% YoY)
- Months Supply of Inventory (MSI): 2.1 (↑ 2.8% MoM, ↓ 15.8% YoY)
Market Overview
The Carson City housing market held firm in September, with closed sales rising ↑ 14.5% month-over-month and ↑ 6.8% year-over-year.
Even as activity picked up, median prices continued to climb ↑ 8.1% to reach $550,000.
On a price-per-square-foot basis, the market slipped slightly ↓ 1.8% from August but remained a healthy ↑ 10.2% higher than a year ago.
Pricing Trends
September’s $550,000 median sales price underscores Carson City’s steady upward trend in home values.
Despite mild fluctuations in the $324 per-square-foot metric, the strong year-over-year appreciation points to continued buyer confidence.
The modest month-to-month dip suggests a seasonal balancing—buyers are still active, but more selective on price and features.
Inventory and Supply
- Active listings: 133 (↑ 17.7% MoM, ↓ 10.1% YoY)
- New listings: 56 (↓ 21.6% MoM, ↓ 14.9% YoY)
- MSI: 2.1 months (↑ 2.8% MoM, ↓ 15.8% YoY)
Inventory saw a month-over-month increase but remains below 2024 levels. The combination of fewer new listings and steady buyer activity
continues to pressure supply—keeping the market tilted in favor of sellers.
An MSI of 2.1 months is still well below the 4–6 month range typically considered balanced.
Market Velocity
Homes spent a median of 70 days on market in September—↓ 6.7% faster than in August but ↑ 1.4% longer than a year ago.
This suggests listings are moving at a consistent pace, even as buyers weigh more options amid higher inventory levels.
The 98.9% list-to-sold price ratio indicates sellers are achieving nearly full asking price, a reflection of continued buyer competition.
Market Takeaways
Sellers →
- Price strength remains intact with values ↑ 8.1% MoM and ↑ 2.8% YoY.
- Accurate pricing is critical as buyers are scrutinizing value—especially with higher days on market.
- Well-presented, move-in-ready homes continue to command strong offers.
Buyers ←
- More inventory ↑ 17.7% MoM means improved selection heading into fall.
- While median prices are higher, the slight dip ↓ in PPSF presents opportunity in larger or updated homes.
- Be prepared to act quickly when a home aligns with your needs and price range.
Ready to make your next move?
Whether you’re considering buying or selling in Carson City, let’s tailor a strategy that fits your timeline and goals.
Call or text me today to start the conversation.