
Here is our Carson City real estate market report for June 2026 — a data-driven look at home prices, sales, inventory, and market speed across the region.
How does this compare? Read last month’s Carson City market report.
Market Snapshot (SFRs and Condo/Townhomes)
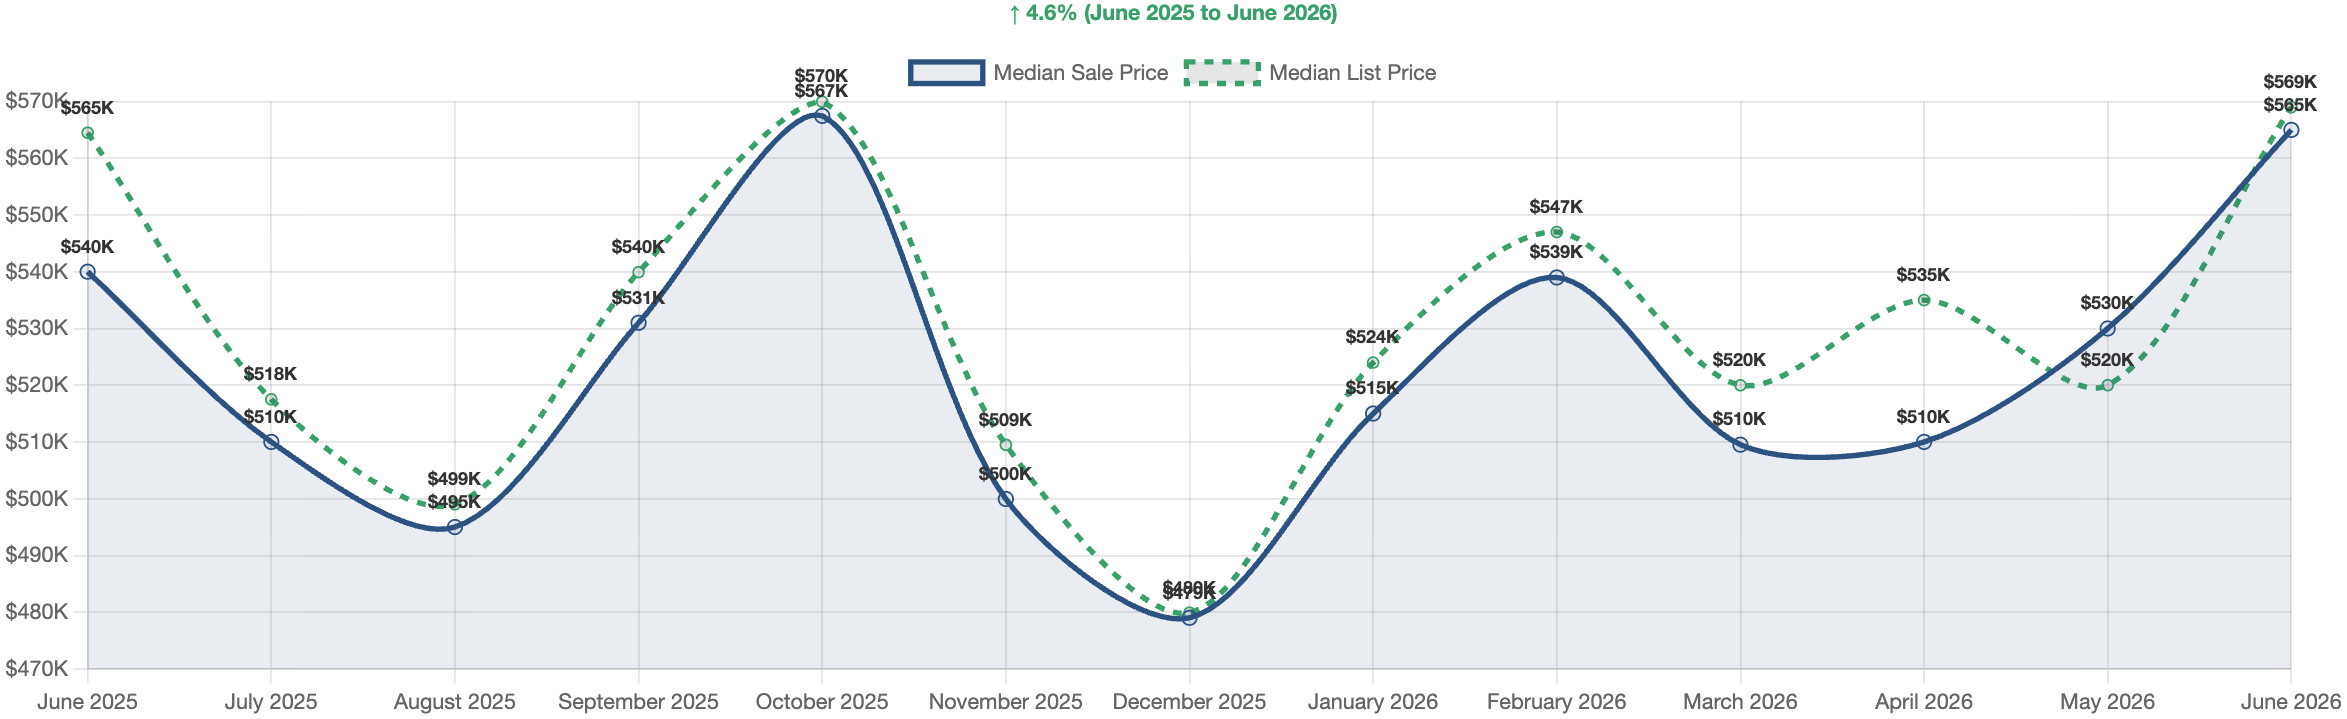
Carson City’s housing market shifted into high gear in June 2026, with closed sales surging 62.3% year-over-year and the median sale price climbing to $565,000 — a 6.6% jump from just one month ago. At the same time, months of supply fell to a razor-thin 1.6 months, signaling that demand is outpacing new supply and that sellers hold a strong hand heading into summer.
🏠 Single Family Residences
Pricing and Sales Volume
The single family home market in Carson City had a standout month in June. Closed sales reached 87, a dramatic 40.3% jump from May and a massive 77.6% increase from this time last year. Total sales volume hit $75,160,818, showing just how much activity is moving through the market right now. The median sale price came in at $581,990, which is up 3.8% month-over-month. However, it is worth noting that this figure sits 3.0% below where it was one year ago, suggesting that while momentum is building, prices are still finding their footing on an annual basis.
Inventory and Market Speed
Inventory remains very tight for single family homes. There are only 124 active listings right now, with 80 homes already pending. As a result, months of supply has dropped to just 1.4 months — down 24.7% from last month and a striking 44.4% below year-ago levels. That puts this segment firmly in seller’s market territory. On top of that, homes are moving fast. The median days to contract is just 9.0 days, and median days on market sits at 49 — down 11.7% from May. Meanwhile, new listings came in at 79 for the month, which is healthy but still not enough to meaningfully ease the supply crunch.
Price Reductions and List Price Performance
Even in a tight market, some sellers are adjusting their expectations. About 23.0% of sales had a price cut before going under contract, with a median reduction of 3.2%, or roughly $25,500. That said, the overall sold-to-original-list-price ratio landed at exactly 100.0%, meaning that on average, homes are selling right at their original asking price. This tells us that well-priced homes are getting full value, while overpriced listings are still getting corrected before they close.
What This Means for SFR Buyers and Sellers
For sellers, conditions are about as good as it gets. With only 1.4 months of supply and homes going under contract in a median of just 9 days, there is very little room for buyers to negotiate. For buyers, the challenge is acting quickly and coming in with a realistic offer from day one. With 26.4% of purchases made in cash, financed buyers are competing against well-capitalized offers. Furthermore, the jump in closed sales year-over-year signals that more buyers have accepted current pricing and are moving forward — which means competition is not likely to ease up soon.
SFR Sales by Price Range
| Price Range | Sales | % of Total |
|---|---|---|
| Over $1M | 14 | 16.1% |
| $750K-$1M | 11 | 12.6% |
| $600K-$750K | 16 | 18.4% |
| $500K-$600K | 20 | 23.0% |
| $400K-$500K | 20 | 23.0% |
| $300K-$400K | 3 | 3.4% |
| Under $300K | 3 | 3.4% |
🏢 Condos & Townhomes
Pricing and Sales Activity
The condo and townhome market tells a different story than single family homes this month. Closed sales came in at just 12, a drop of 20.0% from May, though year-over-year sales were flat at 0.0% change. Total sales volume reached $4,007,950, and the median sale price held steady at $389,995 — unchanged from the prior month but up 4.0% from one year ago. In contrast to the SFR segment, the sold-to-original-list ratio came in at 97.0%, meaning buyers are winning modest concessions off the asking price. Similarly, the median price per square foot was $253.48, notably lower than the $335.46 seen in the SFR market.
Inventory and Time on Market
Inventory in the condo and townhome segment is rising, and that shift matters. There are currently 37 active listings alongside 19 pending sales, pushing months of supply to 3.1 months — up a significant 18.5% from last month and up 36.9% year-over-year. This puts the condo market right at the edge of balanced territory. New listings came in at 13 this month, which is slightly more than the number of homes that closed. As a result, supply is gradually building. On the flip side, homes are still moving at a reasonable pace — median days to contract was 8.5 days, and median days on market was 50. However, days on market did tick up 4.2% from last month, a trend worth watching.
Price Reductions and Seller Behavior
Price reductions are slightly more common in the condo segment compared to single family homes. Specifically, 25.0% of condo sales involved a price cut, with a median reduction of 3.8%, or about $12,001. That is a higher percentage reduction than the 3.2% seen on the SFR side. Because of this, sellers in the condo market may need to be a bit more flexible on price to attract buyers. On top of that, the 97.0% sold-to-list ratio confirms that buyers do have some room to negotiate — unlike in the single family segment where homes are selling at exactly 100% of original list price.
What This Means for Condo Buyers and Sellers
For buyers considering a condo or townhome, conditions are more favorable than in the SFR market. With 3.1 months of supply, there is more to choose from and a bit more room to negotiate. That said, good units are still going under contract quickly — just 8.5 days at the median — so hesitation can still cost you. For sellers, pricing carefully from the start is key, since the 25.0% price-cut rate shows that overpriced listings are being corrected. Overall, this segment is approaching balance, which means both buyers and sellers can expect a more even playing field than what we see in the single family market right now.
Condo/Townhome Sales by Price Range
| Price Range | Sales | % of Total |
|---|---|---|
| Over $1M | 0 | 0.0% |
| $750K-$1M | 0 | 0.0% |
| $600K-$750K | 0 | 0.0% |
| $500K-$600K | 0 | 0.0% |
| $400K-$500K | 4 | 33.3% |
| $300K-$400K | 4 | 33.3% |
| Under $300K | 4 | 33.3% |
Financing Breakdown (All Properties)
| Loan Type | Sales | % of Total |
|---|---|---|
| Conventional | 56 | 56.6% |
| Cash | 27 | 27.3% |
| FHA | 9 | 9.1% |
| VA | 7 | 7.1% |
Carson City Real Estate Market Outlook – June 2026
Carson City’s overall housing market remains firmly in seller’s market territory, with just 1.6 months of supply across all property types and homes going under contract in a median of only 9.0 days. However, the two segments are moving in different directions — single family homes are intensely competitive with supply near historic lows, while condos and townhomes are slowly drifting toward balance as inventory builds. Looking ahead, sellers who price correctly can still expect full-price offers and fast closings. Buyers, on the other hand, need to be prepared, pre-approved, and ready to act the moment a home hits the market. For investors, the 4.6% year-over-year price gain and surging sales volume point to a market with staying power. In short, Carson City is not slowing down — and those who wait may find themselves watching from the sidelines.
Thanks for reading our Carson City real estate market report for June 2026. We publish these updates monthly.
Have Questions About the Carson City Market?
Whether you are considering buying, selling, or simply trying to understand how current market conditions affect your home’s value, local data matters.
For a data-driven look at your specific neighborhood or property type, contact Guy Johnson, REALTOR® with Keller Williams Group One, Inc.
Guy Johnson, REALTOR®
Keller Williams Group One, Inc.
NV Lic. # S.75262.LLC
Phone: (775) 722-4011
Email: guyjohnson@kw.com