
The supply of homes for sale across the United States has been gradually increasing over the past year. According to a recent analysis by ResiClub, active housing inventory nationwide rose 7.9% year-over-year in February 2026, reaching approximately 914,860 homes for sale.
That’s a meaningful improvement from the extremely tight inventory conditions seen during the pandemic housing boom. However, despite the recent gains, the national housing market still has about 17% fewer homes available than in February 2019, before the pandemic reshaped the housing landscape.
So while inventory is rising, the U.S. housing market still hasn’t fully returned to normal levels.

But national trends only tell part of the story. Let’s take a closer look at how Nevada and the Reno Metro housing market compare.
Nevada Housing Inventory: Nearly Back to Pre-Pandemic Levels
Across the state of Nevada, housing inventory has recovered much more dramatically.
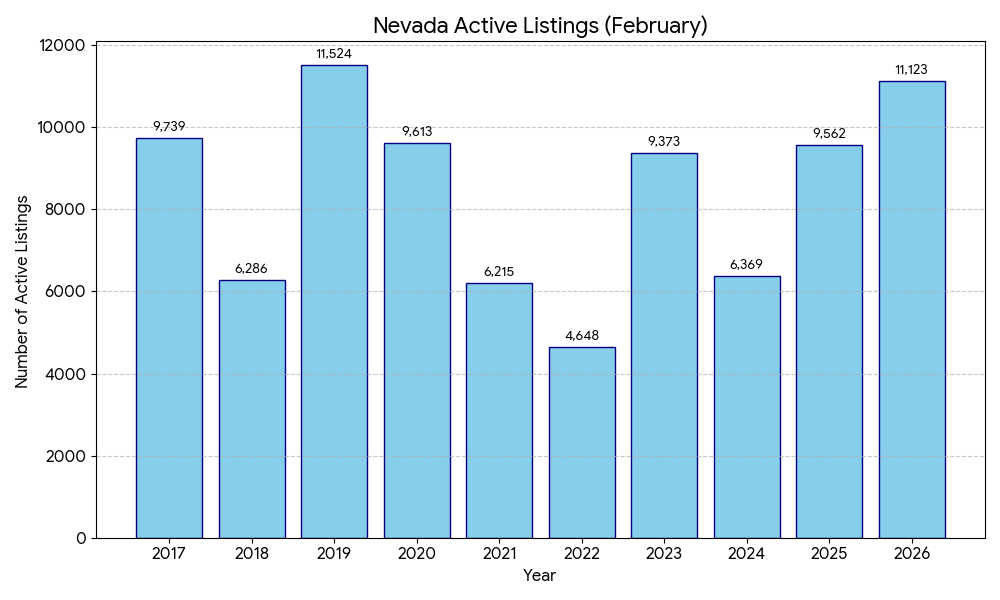
Active listings in Nevada reached 11,123 homes in February 2026, representing a 16.3% increase from February 2025.
Looking at the longer-term trend provides even more perspective.
Nevada Active Listings (February)
- 2017 — 9,739
- 2018 — 6,286
- 2019 — 11,524
- 2020 — 9,613
- 2021 — 6,215
- 2022 — 4,648
- 2023 — 9,373
- 2024 — 6,369
- 2025 — 9,562
- 2026 — 11,123
At the lowest point of the pandemic housing shortage, Nevada inventory fell to just 4,648 homes in February 2022.
Since then, the number of homes for sale has more than doubled.
Importantly, Nevada’s February 2026 inventory level is now only about 3.5% below February 2019, meaning the state’s housing supply has essentially returned to pre-pandemic levels.
That’s a much stronger recovery than the national market overall.
But what about Reno?
Reno Metro Housing Inventory: Still Far Below Pre-Pandemic Levels
While Nevada’s statewide inventory has largely recovered, the Reno Metro housing market remains much tighter.
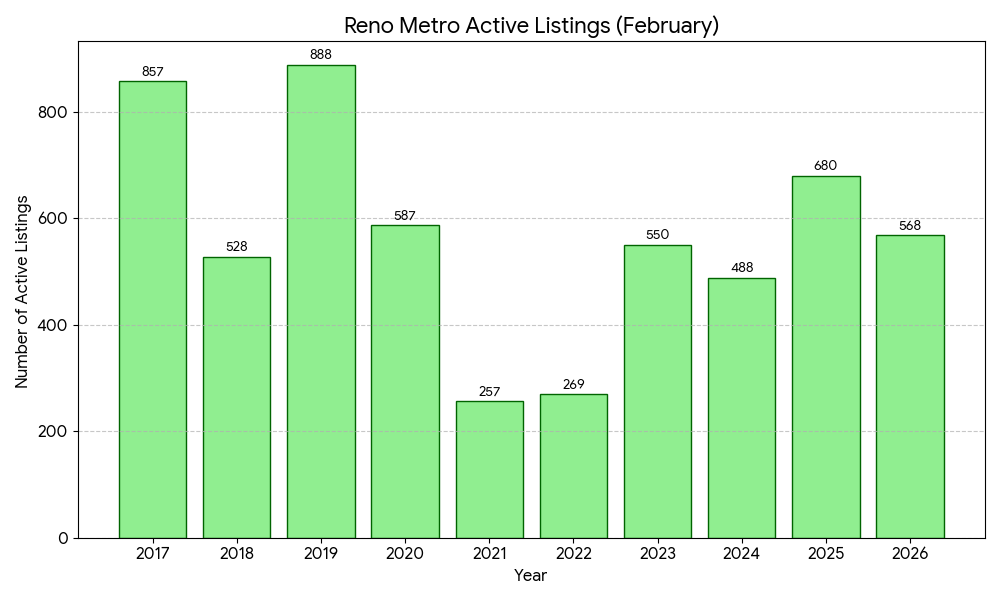
Here is the historical February inventory for Reno single-family homes.
Reno Metro Active Listings (February)
- 2017 — 857
- 2018 — 528
- 2019 — 888
- 2020 — 587
- 2021 — 257
- 2022 — 269
- 2023 — 550
- 2024 — 488
- 2025 — 680
- 2026 — 568
The pandemic-era housing shortage hit Reno particularly hard.
Inventory fell to just 257 homes in February 2021, a dramatic drop from the 888 homes available in February 2019.
Although inventory has improved since then, the market still hasn’t fully recovered.
February 2026 inventory stood at 568 active listings, which is about 36% lower than February 2019 levels.
In other words, while Nevada overall has nearly returned to normal inventory conditions, Reno still has significantly fewer homes available than before the pandemic.
Months of Supply Shows Reno Is Still a Tight Market
Another useful metric for understanding housing supply is Months of Supply (MSI). This measures how long it would take to sell all current listings at the current pace of sales.
Reno Metro Months of Supply (February)
- 2017 — 2.2 months
- 2018 — 1.2 months
- 2019 — 2.4 months
- 2020 — 1.3 months
- 2021 — 0.7 months
- 2022 — 0.7 months
- 2023 — 2.0 months
- 2024 — 1.6 months
- 2025 — 2.1 months
- 2026 — 1.8 months
For context, a balanced housing market typically has around 4–6 months of supply.
With just 1.8 months of supply in February 2026, Reno remains firmly in seller’s market territory, despite inventory improving from pandemic lows.
What This Means for Buyers and Sellers
The housing market narrative often sounds very different depending on whether you look at national data or local data.
Nationally, housing inventory is rising but remains well below pre-pandemic levels.
In Nevada, inventory has largely recovered and is now very close to 2019 levels.
But in Reno, the housing market still faces a significant supply shortage compared to the pre-pandemic period.
This helps explain why home prices in the Reno area have remained relatively resilient despite higher mortgage rates over the past several years.
Until the number of homes available for sale rises meaningfully, the Reno housing market will likely remain supply-constrained compared to historical norms.
Final Thoughts
Housing inventory across the United States is slowly improving, but the recovery has been uneven across markets.
Using 2019 as a baseline helps illustrate how differently inventory has recovered across the national, state, and local housing markets.
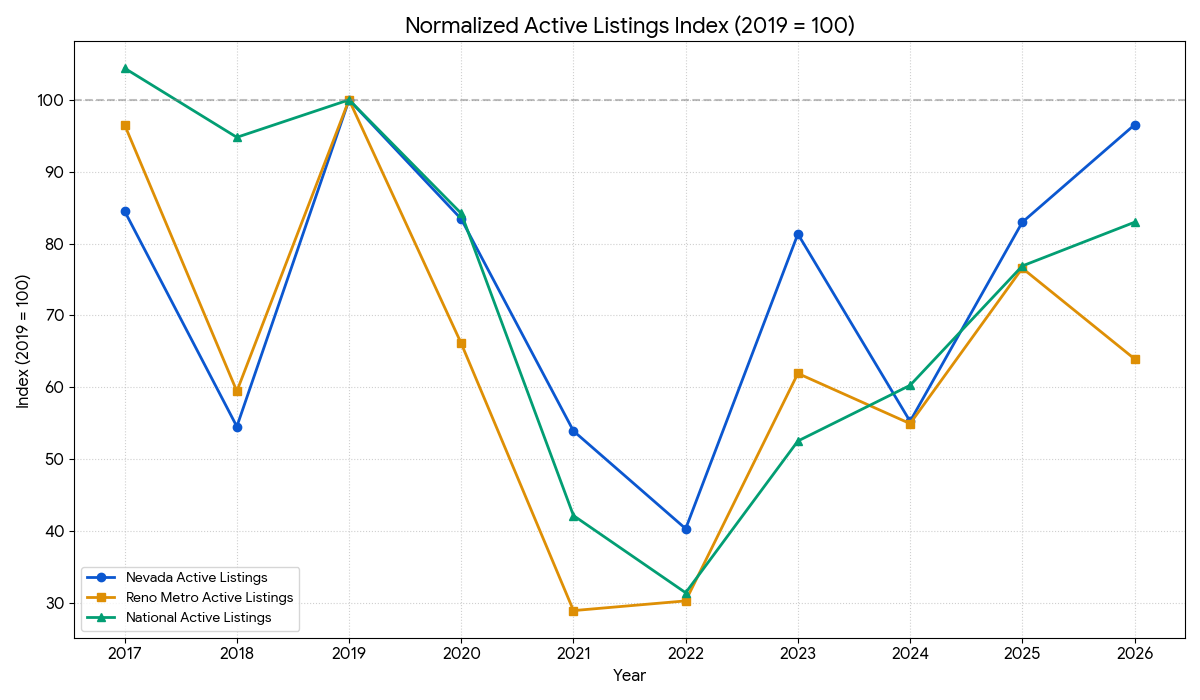
Nevada’s housing supply has rebounded strongly and is now nearly back to pre-pandemic levels. Reno, however, continues to face a much tighter housing environment with far fewer homes available than before the pandemic.
For buyers and sellers in Northern Nevada, that means local market conditions still matter far more than national headlines.
Understanding those local dynamics is key to making informed real estate decisions.
Source
National inventory data referenced in this article comes from:
ResiClub Analytics — U.S. housing market inventory is up 8% year over year—that rate keeps decelerating
Curious How Inventory Levels Affect Your Home’s Value?
Many homeowners are surprised to learn how limited housing supply still is in the Reno area compared with pre-pandemic levels.
If you’re curious how current inventory levels are affecting the value of homes in your neighborhood, I would be happy to provide a custom market analysis for your property.
Because every neighborhood behaves a little differently, the best way to understand the market is to look at the most recent sales, current listings, and local inventory trends in your specific area.
Feel free to reach out if you’d like to discuss the market or receive an updated estimate of your home’s value.
Guy Johnson, REALTOR®
Keller Williams Group One, Inc.
Nevada License S.75262.LLC
📞 (775) 722-4011
✉️ guyjohnson@kw.com
Data courtesy of the Northern Nevada Regional MLS. Data is deemed reliable but not guaranteed. Any errors or omissions are unintentional. Portions of this report were generated with ChatGPT and reviewed by the author for accuracy.