
Here is our Reno/Sparks real estate market report for June 2026 — a data-driven look at home prices, sales, inventory, and market speed across the region.
How does this compare? Read last month’s Reno/Sparks market report.
Market Snapshot (SFRs and Condo/Townhomes)
The Reno/Sparks housing market picked up steam in June 2026, with 615 closed sales pushing total volume to $441,194,620 — a jump of 12.6% from last month and 17.6% from a year ago. At the same time, the median sale price climbed to $596,000, up 4.6% year-over-year, while months of supply fell to just 1.7. In short, buyers came out in force this summer, and sellers held the upper hand.
🏠 Single Family Residences
The Big Story: Prices Keep Climbing
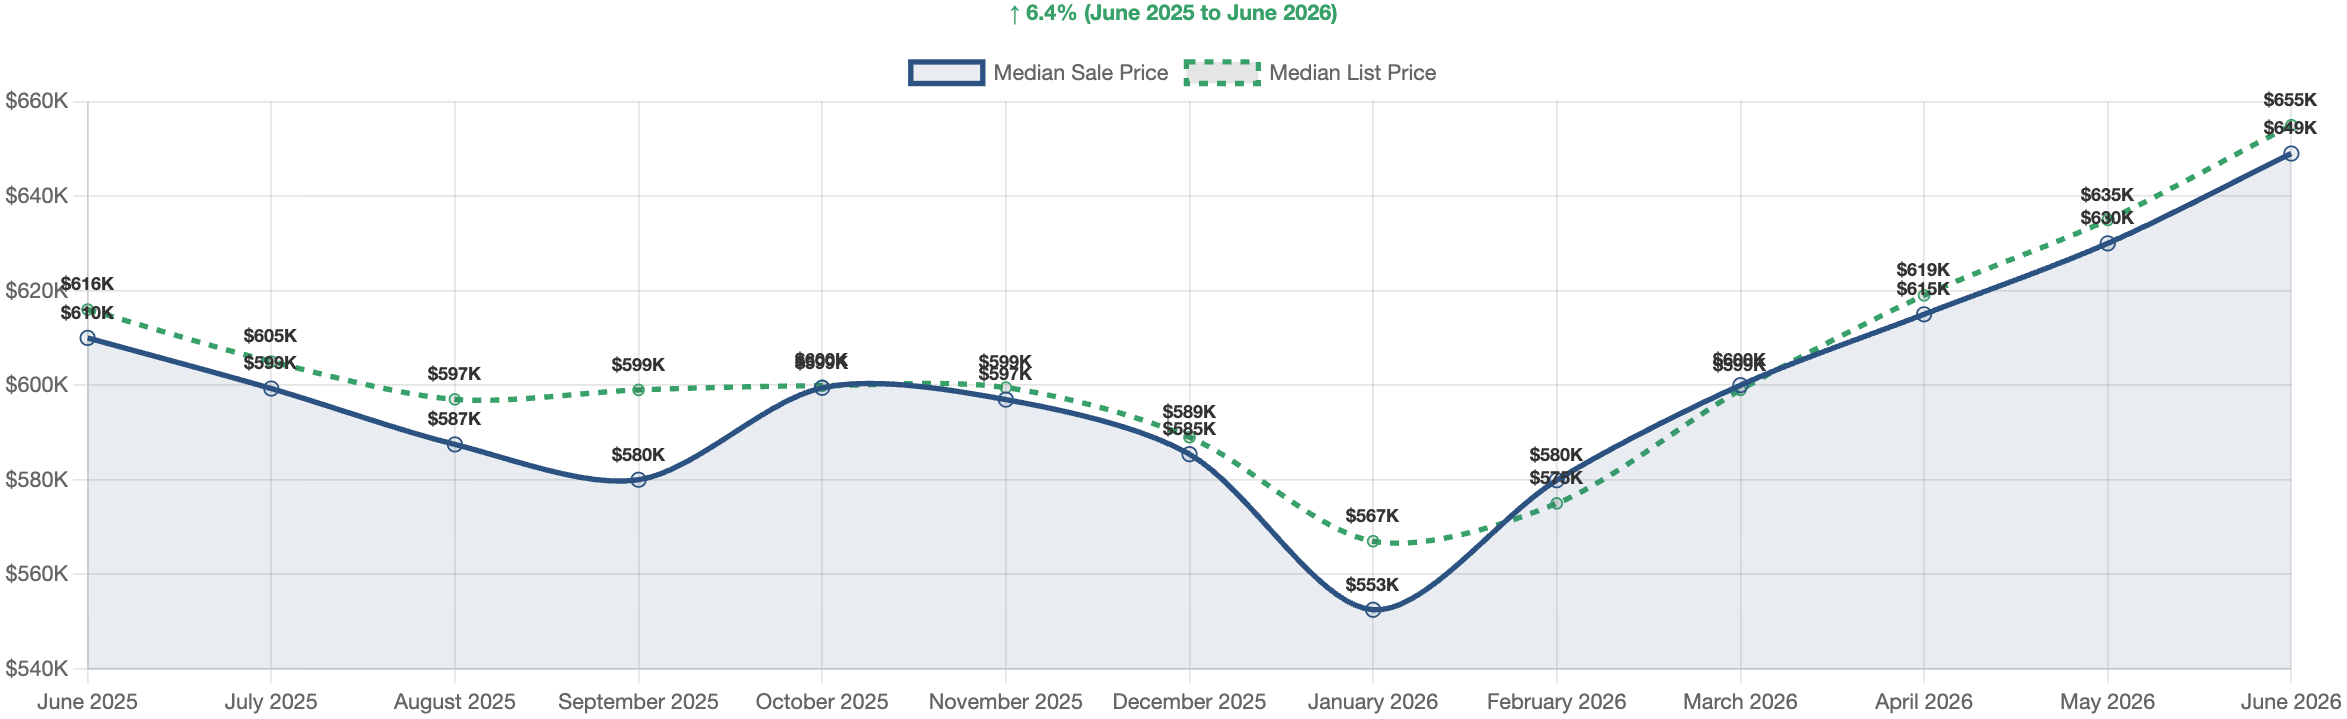
Single family homes hit a new high note in June, with the median sale price reaching $648,999. That marks a gain of 3.0% from May and a strong 6.4% from this time last year. In addition, the median price per square foot came in at $334.28, showing that buyers are paying up across the board. Sales were busy too, with 499 homes closing for a total of $395,615,255 in volume. That said, homes sold at 98.9% of their original list price, so most sellers landed close to their asking number without going over it.
Market Timing and Seller Activity
Homes took a median of 51 days on market to close, up 15.9% from last month. However, the more telling number is days to contract, which sat at just 15.0 days. To put it simply, well-priced homes are getting offers in about two weeks. Meanwhile, sellers stayed active, bringing 541 new listings to market — slightly more than the 499 homes that sold. Because of this, buyers got a bit of fresh choice, yet not enough to shift the balance of power.
Inventory and Price Cuts
Active listings stood at 827, with another 571 homes pending. As a result, months of supply held at a tight 1.7 — well inside seller’s market territory, and down 31.4% from a year ago. Still, not every seller sailed through. Notably, 27.5% of sales needed a price cut before closing, with a median reduction of 3.8%, or about $25,000. In other words, pricing right from day one matters, even in a hot market.
What It Means for Buyers and Sellers
For sellers, the message is clear: demand is strong, prices are rising, and homes are going under contract fast. Even so, overpricing still leads to cuts, so realistic pricing pays off. On the flip side, buyers face rising prices and thin inventory, which means acting quickly on the right home. With cash making up 26.5% of sales, financed buyers should come in with strong, clean offers.
SFR Sales by Price Range
| Price Range | Sales | % of Total |
|---|---|---|
| Over $1M | 91 | 18.2% |
| $750K-$1M | 86 | 17.2% |
| $600K-$750K | 119 | 23.8% |
| $500K-$600K | 116 | 23.2% |
| $400K-$500K | 72 | 14.4% |
| $300K-$400K | 15 | 3.0% |
| Under $300K | 0 | 0.0% |
🏢 Condos & Townhomes
Sales Surge Despite a Price Dip
The condo and townhome market told a lively story in June. Closed sales jumped to 116 units, up 23.4% from May and a striking 50.6% from a year ago. However, the median sale price slipped to $340,000, down 4.9% month-over-month. Despite this, the bigger picture is strong — prices are still up 15.3% year-over-year, the best annual gain in the market. Total volume reached $45,579,365, and units sold at 98.7% of original list price.
Timing and New Listings
Condos moved a bit slower than single family homes, with a median of 64 days on market and 25.5 days to contract. In contrast, SFR buyers made offers about ten days faster. Even so, condo timing improved from last year, with days on market down 13.5%. Meanwhile, sellers brought 113 new listings to market — just under the 116 sales for the month. Consequently, demand is eating through supply faster than new listings can replace it.
Inventory and Price Cuts
Active listings totaled 233, with 121 units pending. That works out to 2.0 months of supply, down a sharp 17.6% from last month and 56.0% from a year ago. Notably, price cuts ran a bit deeper here than in the SFR market. Specifically, 30.2% of condo sales needed a reduction, with a median cut of 5.6%, or $20,000. Therefore, condo sellers need to be extra careful with their opening price.
What It Means for Buyers and Sellers
For buyers priced out of single family homes, condos remain the most affordable door into this market at $282.01 per square foot. Also, the slower pace gives buyers a little more breathing room to decide. On the other hand, sellers should feel confident — supply is shrinking fast and yearly price gains are outpacing the SFR market. With cash buyers making up 27.6% of sales, investors clearly see value here too.
Condo/Townhome Sales by Price Range
| Price Range | Sales | % of Total |
|---|---|---|
| Over $1M | 3 | 2.6% |
| $750K-$1M | 2 | 1.7% |
| $600K-$750K | 4 | 3.4% |
| $500K-$600K | 10 | 8.6% |
| $400K-$500K | 23 | 19.8% |
| $300K-$400K | 31 | 26.7% |
| Under $300K | 43 | 37.1% |
Financing Breakdown (All Properties)
| Loan Type | Sales | % of Total |
|---|---|---|
| Conventional | 312 | 50.7% |
| Cash | 164 | 26.7% |
| FHA | 80 | 13.0% |
| VA | 41 | 6.7% |
| Other | 10 | 1.6% |
| Private | 6 | 1.0% |
| Seller Financed | 2 | 0.3% |
Sales by City
| City | Sales | Median Price |
|---|---|---|
| Reno | 436 | $625,000 |
| Sparks | 179 | $575,000 |
Reno/Sparks Real Estate Market Outlook – June 2026
Overall, June 2026 painted the picture of a firm seller’s market in Reno/Sparks, with just 1.7 months of supply market-wide and prices rising in both segments year-over-year. Looking ahead, sellers should expect strong demand through the summer, yet they should price carefully, since roughly 28.0% of sales still needed a cut. For buyers, waiting carries a cost — with supply down 37.2% from last year, competition is only tightening. Meanwhile, investors may find the condo market especially appealing, given its 15.3% annual price growth and shrinking inventory. In short, this market rewards speed and smart pricing: homes priced right go under contract in about two weeks, while everything else waits for a discount.
Thanks for reading our Reno/Sparks real estate market report for June 2026. We publish these updates monthly.
Have Questions About the Reno/Sparks Market?
Whether you are considering buying, selling, or simply trying to understand how current market conditions affect your home’s value, local data matters.
For a data-driven look at your specific neighborhood or property type, contact Guy Johnson, REALTOR® with Keller Williams Group One, Inc.
Guy Johnson, REALTOR®
Keller Williams Group One, Inc.
NV Lic. # S.75262.LLC
Phone: (775) 722-4011
Email: guyjohnson@kw.com