Agent Insights
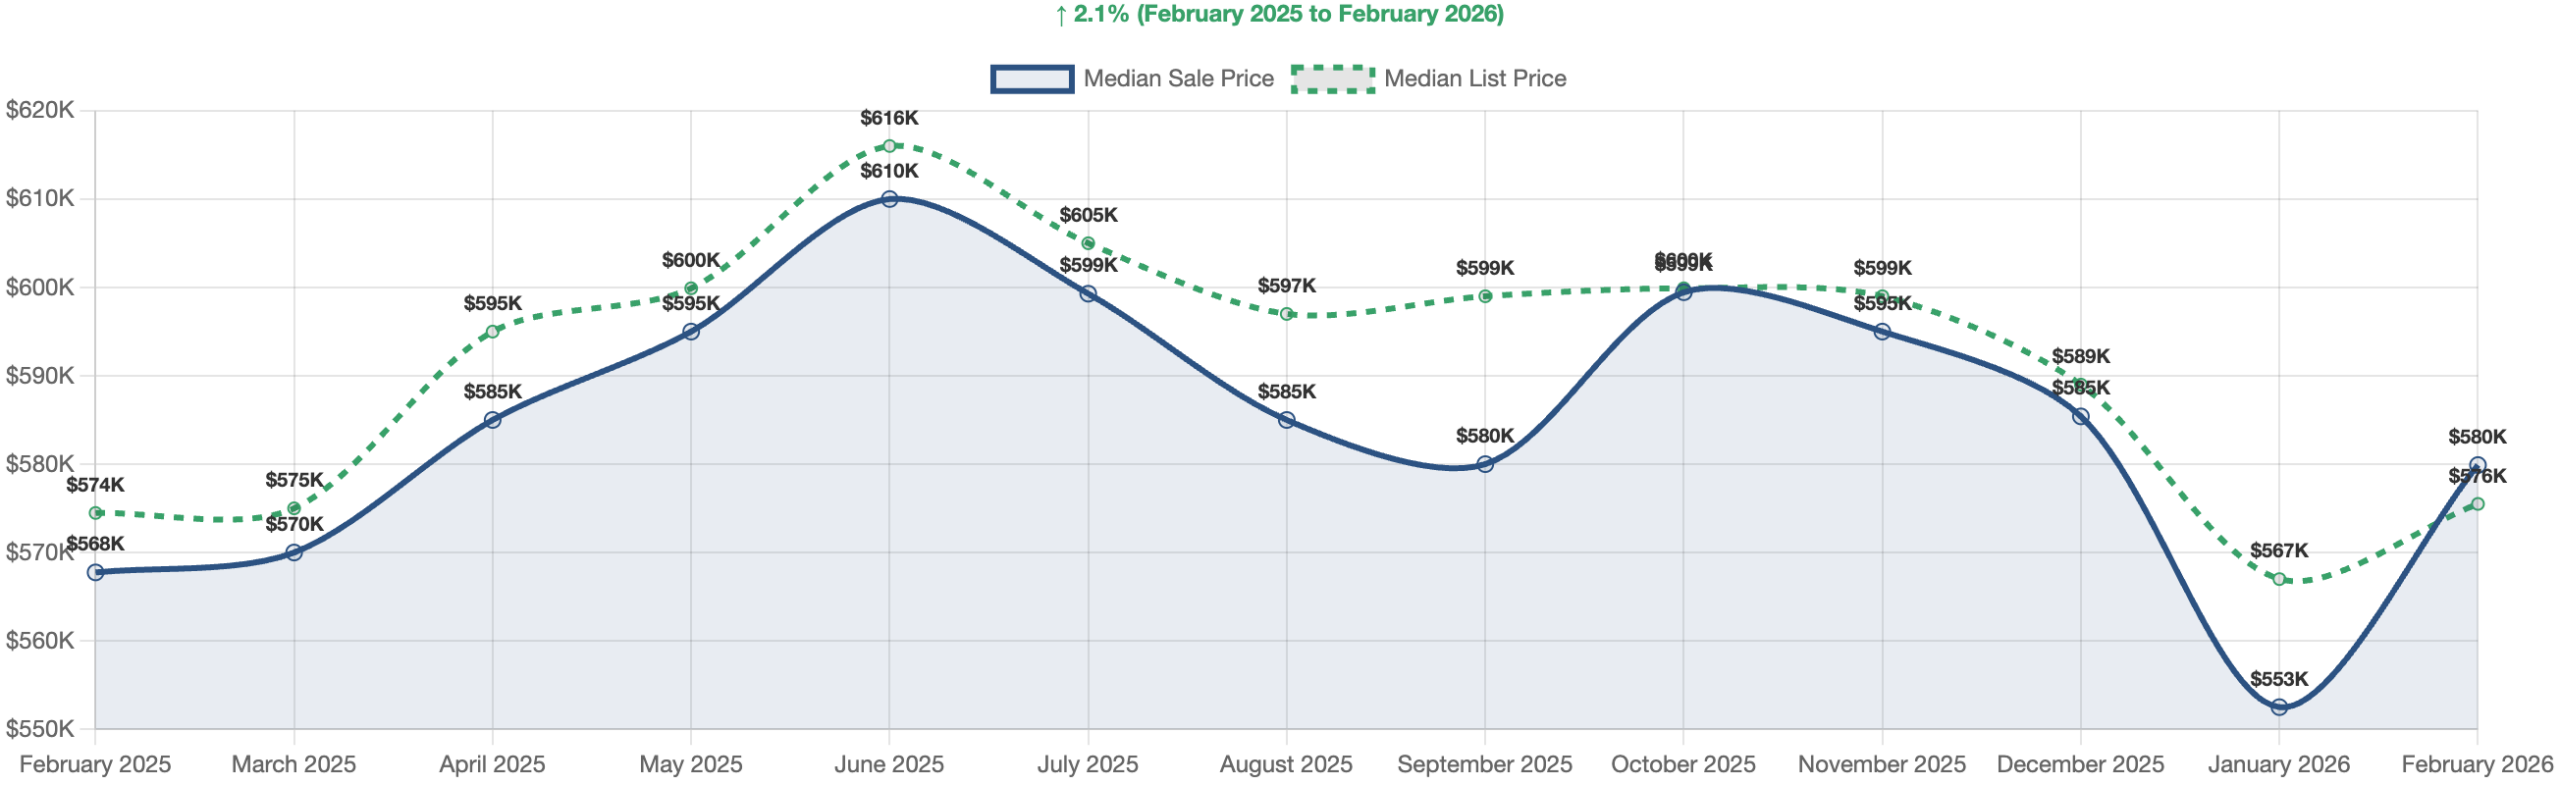
Reno/Sparks Real Estate Market Report – February 2026
Market Snapshot (SFRs and Condo/Townhomes) 377 Total Homes Sold +11.9% vs prev mo -3.3% vs prev yr $549,950 Median Price +4.8% vs prev mo +2.8%

Market Snapshot (SFRs and Condo/Townhomes) 377 Total Homes Sold +11.9% vs prev mo -3.3% vs prev yr $549,950 Median Price +4.8% vs prev mo +2.8%
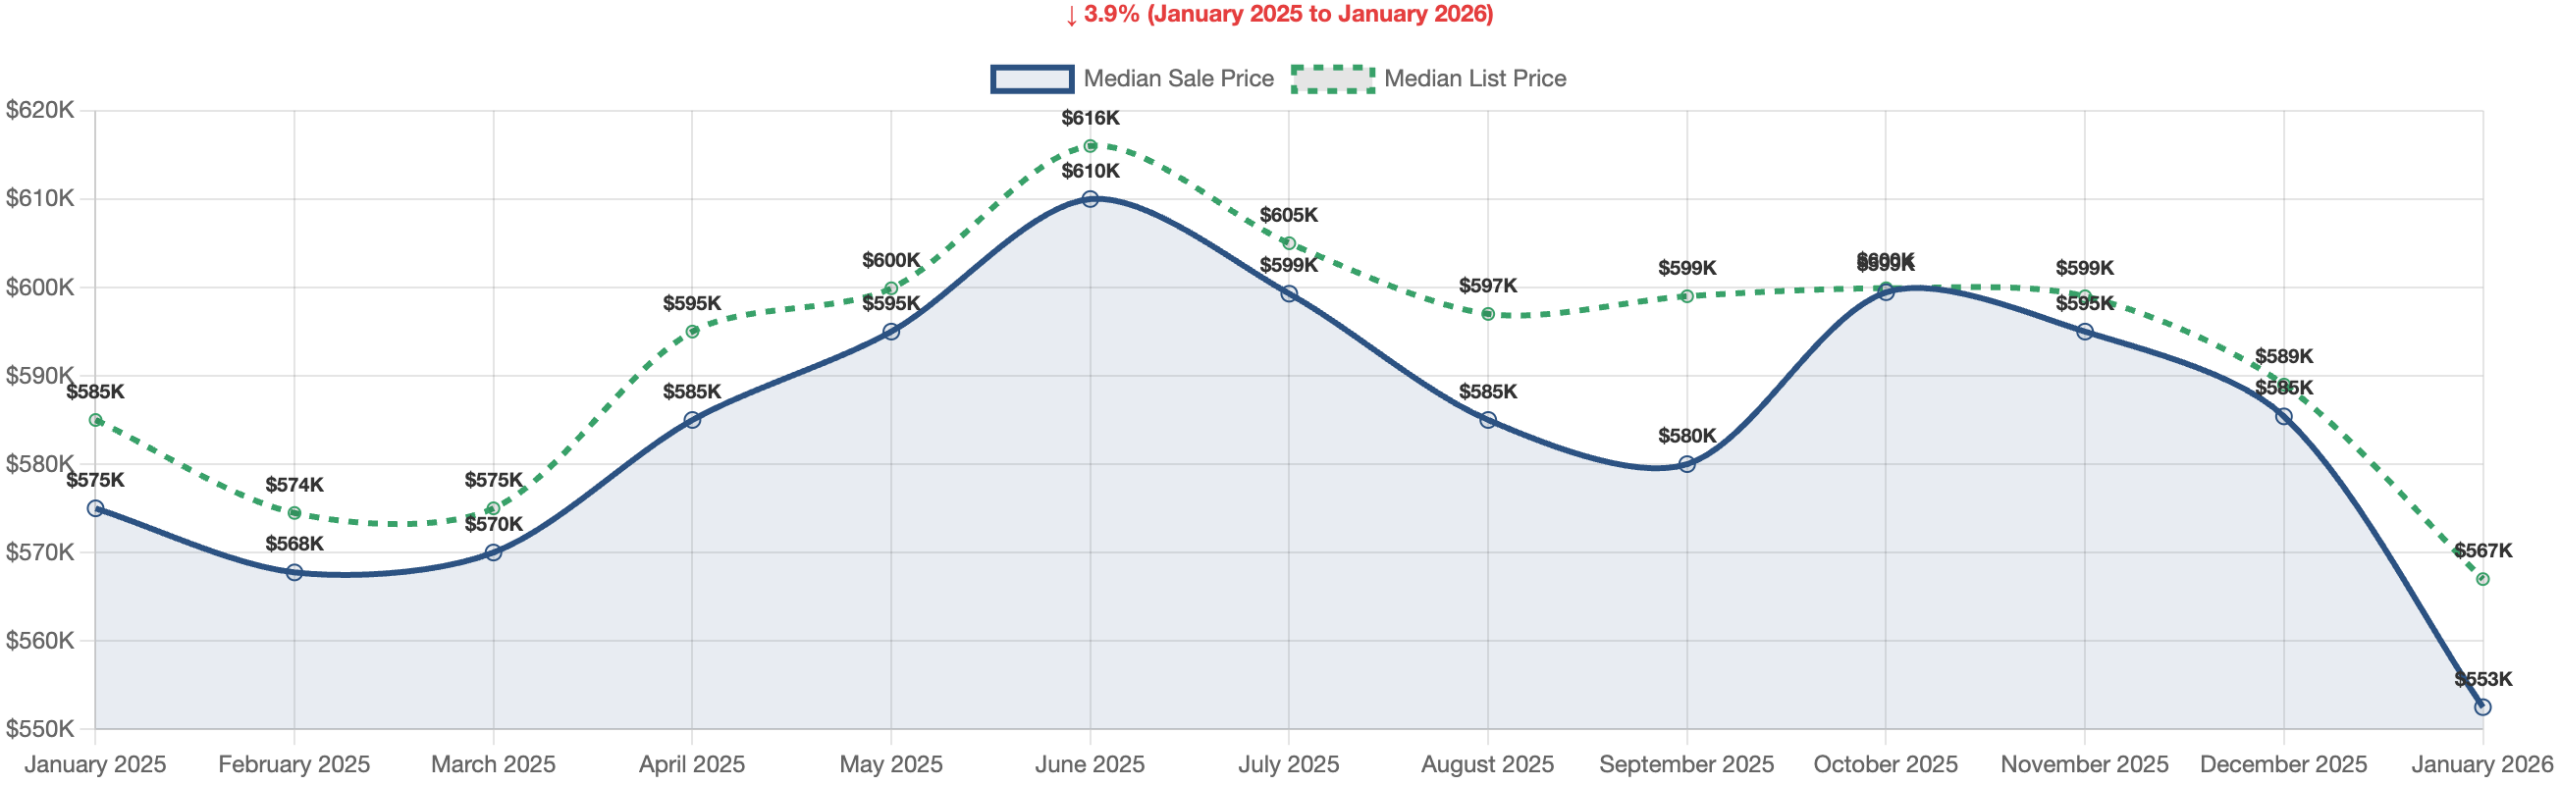
Market Snapshot (SFRs and Condo/Townhomes) 337 Total Homes Sold -28.6% vs prev mo -6.4% vs prev yr $525,000 Median Price -2.8% vs prev mo -0.1%
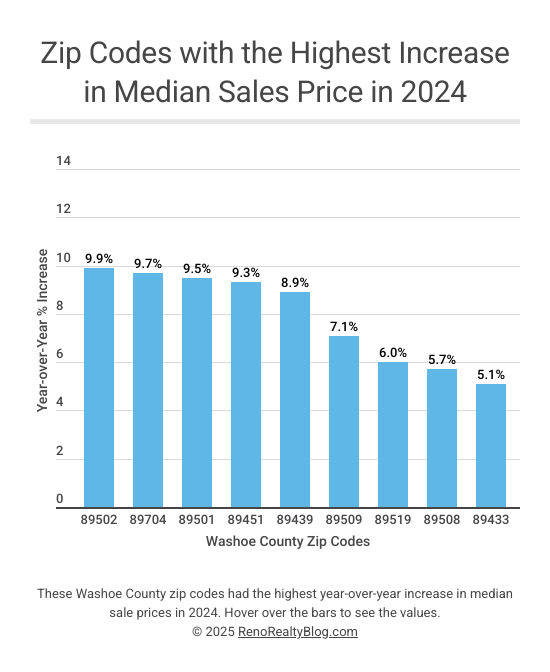
It’s that time of year again to provide the numbers for one of this blog’s most frequently searched-for topics—“home sales by zip code”. Before we
The most recent S&P CoreLogic Case-Shiller Index numbers have been released and they show that home prices nationally rose 19.2% year over year in January,
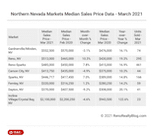
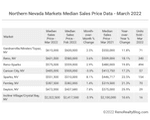
Let’s take a look at March’s median sales price data for markets across Northern Nevada. The table below shows March’s median home sales prices; month-over-month
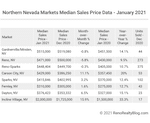
Let’s take a look at January’s median sales price data for markets across Northern Nevada. The table below shows January’s median home sales prices; month-over-month
Earlier this week the Reno Gazette-Journal reported that “The median sales price for an existing single-family home in the city of Reno — not including
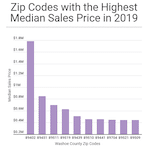
One of this blog’s most frequently searched-for topics is “home sales by zip code”. As such, each January, I post an analysis of the prior