Agent Insights
September 2025 Reno/Sparks Housing Market
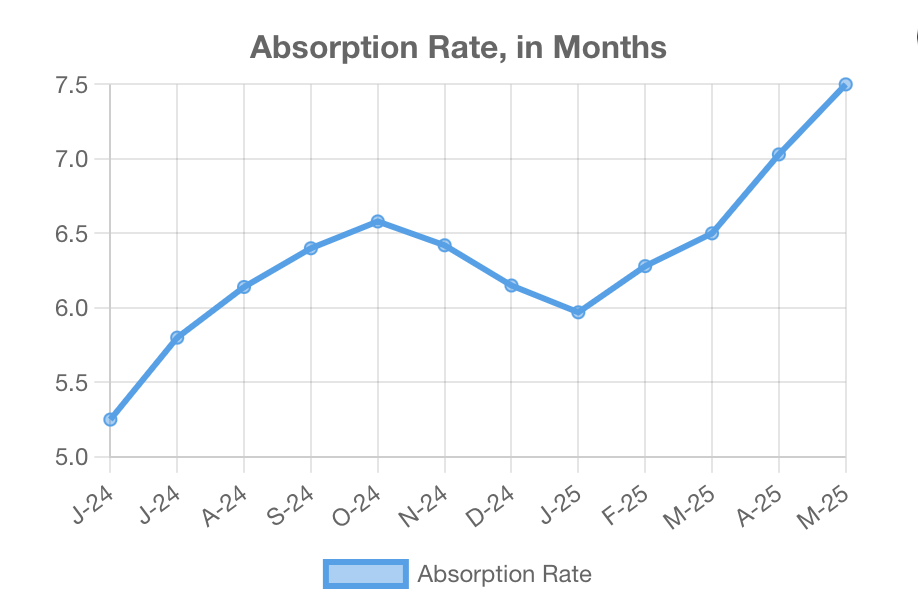
Prices Steady, Inventory Stable The Reno/Sparks housing market continued to show stability in September 2025, with single-family home sales holding steady and price trends remaining

Prices Steady, Inventory Stable The Reno/Sparks housing market continued to show stability in September 2025, with single-family home sales holding steady and price trends remaining
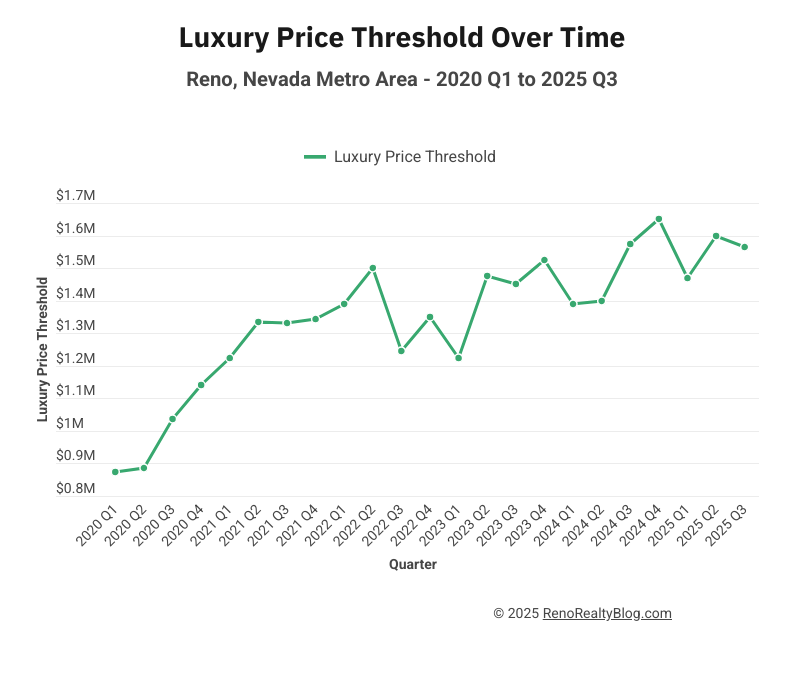
The Reno Metro Area’s real estate market has seen major shifts over the past five years. But perhaps the most compelling story is at the
A new report from Realtor.com is making headlines, declaring that the national real estate market reached a “rare state of balance” in August. For the
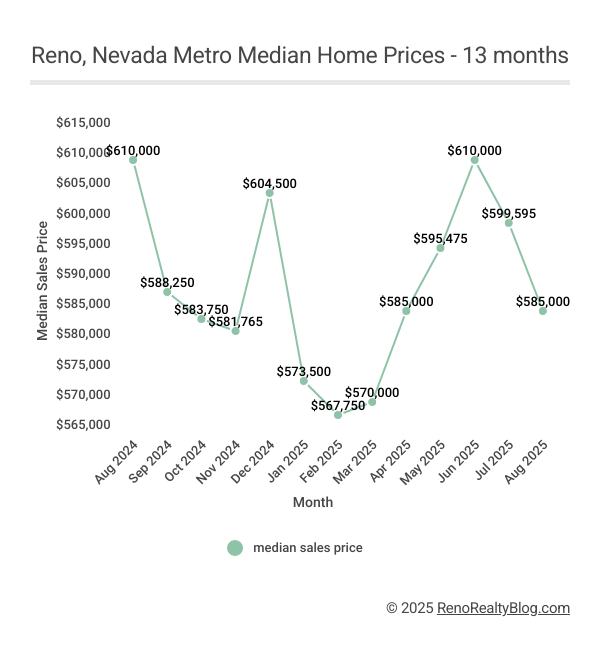
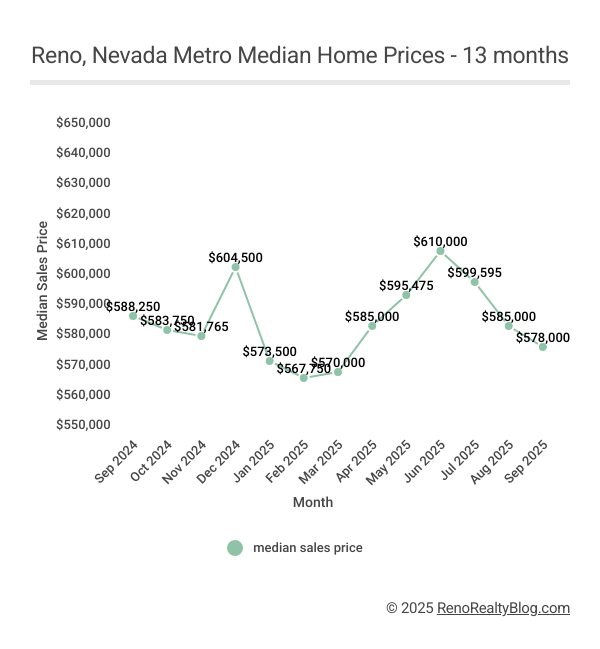
SFR prices pull back; sales remain strong The median SFR home price fell to $585,000 in August—a 2.4% decrease from July’s median. Year-over-year, August’s median
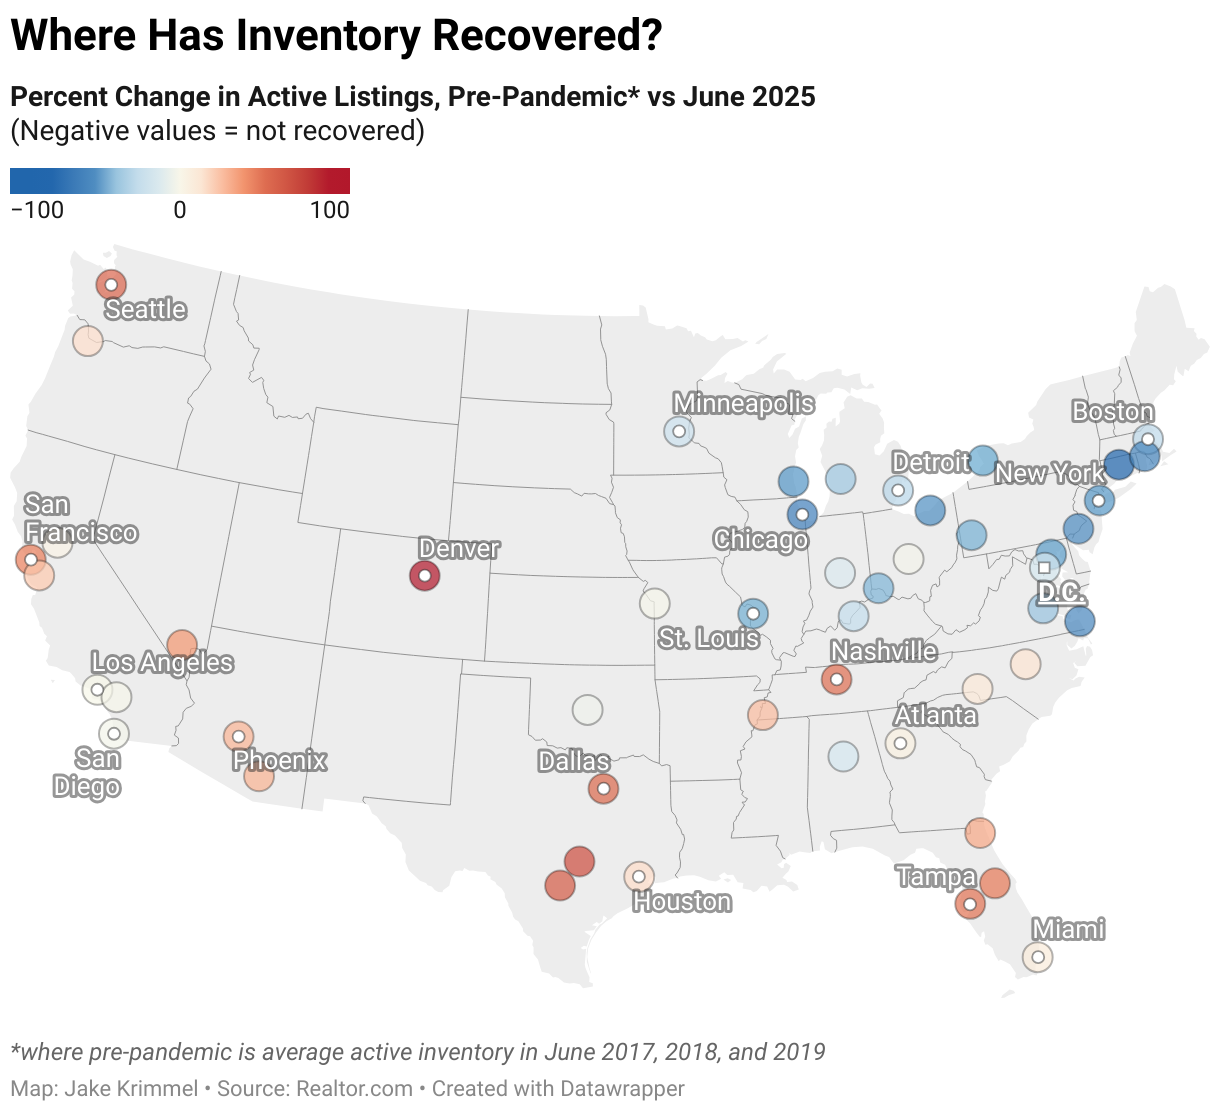
REALTOR.COM® recently released its June 2025 Monthly Housing Market Trends Report, painting a picture of a rebalancing national housing market. As your local real estate
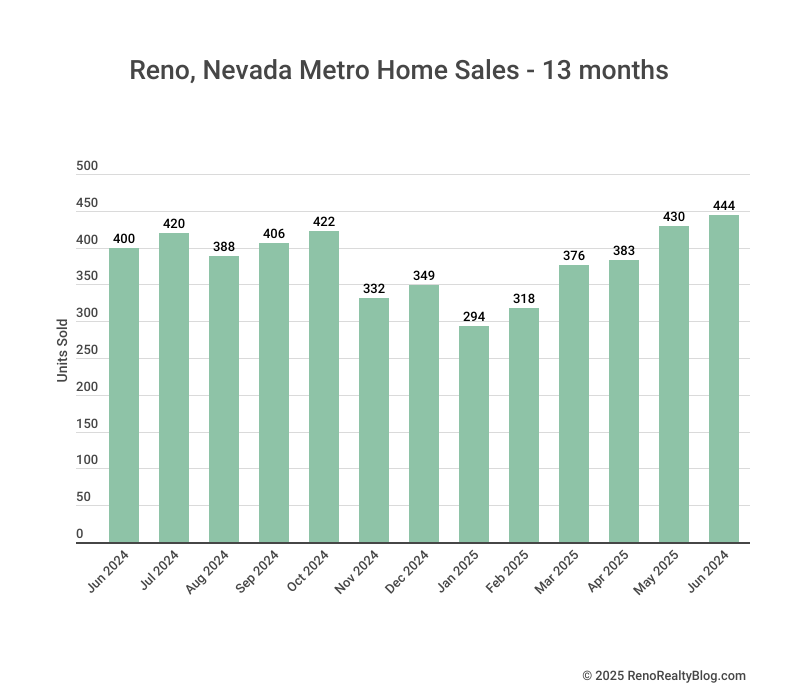
SFR prices, sales, and inventory all continue to climb! Condo/townhome metrics: a different story The median SFR home price rocketed to $607,500 in June—a 2.0%
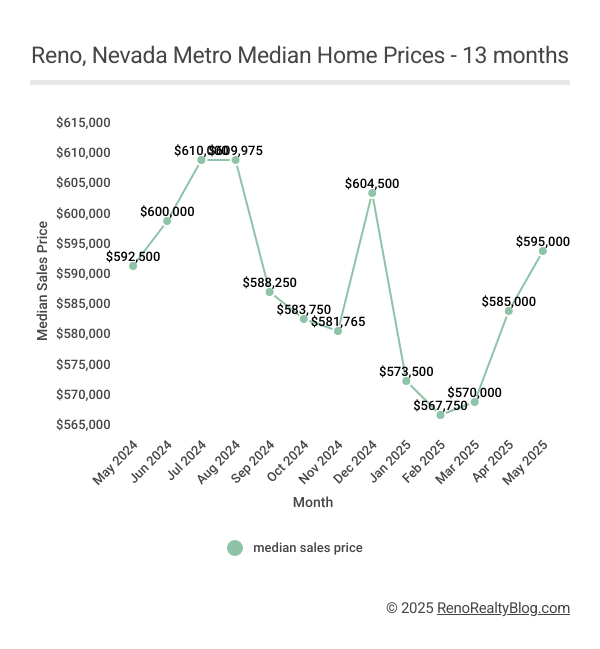
Home prices continue to climb; Inventory rises! The median SFR home price rose to $595,000 in May—a 1.7% increase over April’s median. Year-over-year, May’s median
The U.S. housing market has been a topic of much discussion recently, with national headlines pointing to significant shifts favoring buyers. Recent reports from Redfin,