
Here is our Carson City real estate market report for September 2026 — a data-driven look at home prices, sales, inventory, and market speed across the region.
How does this compare? Read last month’s Carson City market report.
Market Snapshot (SFRs and Condo/Townhomes)
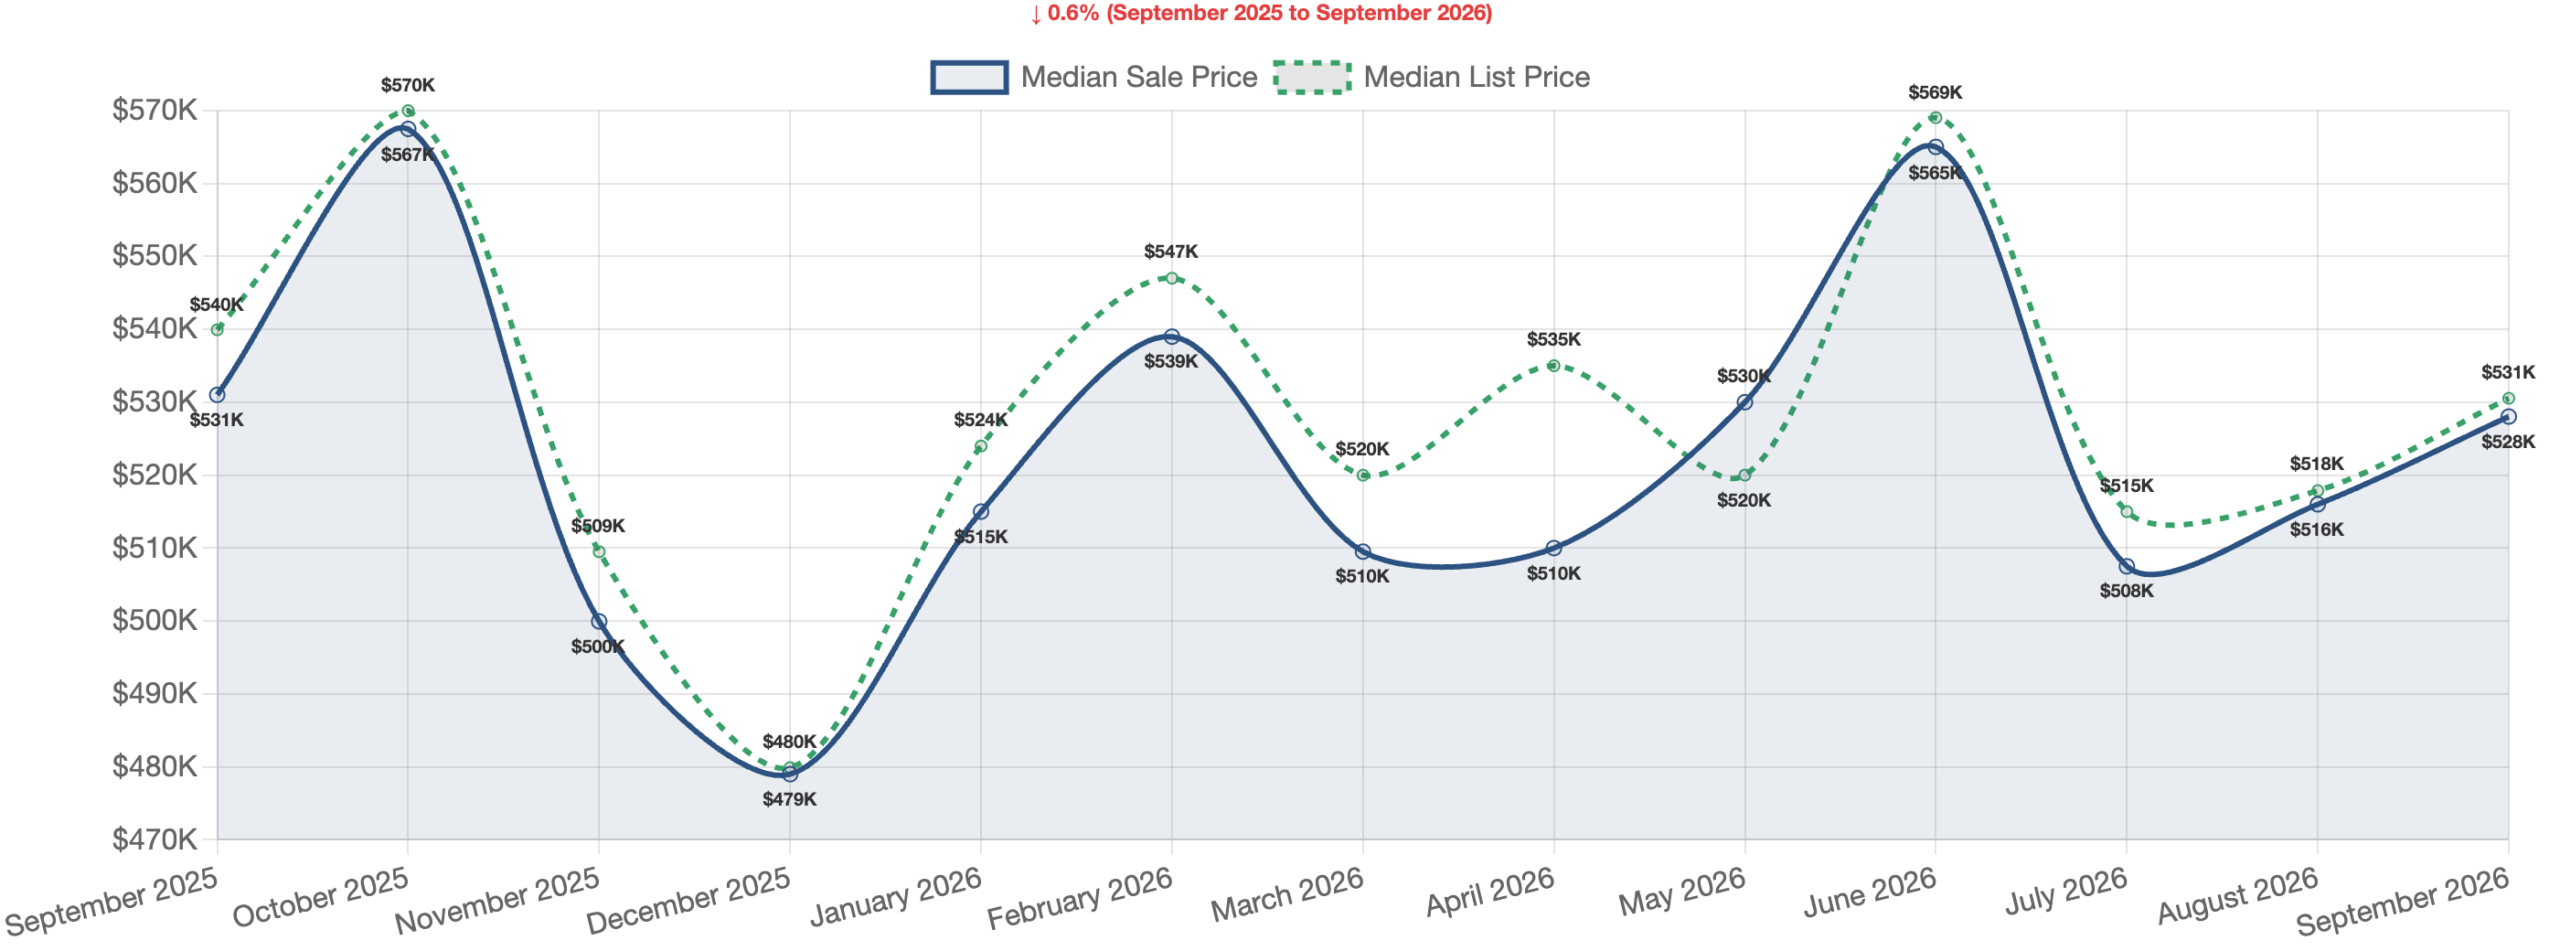
Carson City’s housing market picked up speed in September 2026, with 94 closed sales — a jump of 14.6% from last month and a striking 30.6% gain over last year. Meanwhile, the median sale price landed at $528,035, and supply tightened to just 1.6 months, keeping sellers firmly in control. In short, buyers are active, homes are moving fast, and inventory is not keeping up.
Single Family Residences
The Big Picture for Single Family Homes
Single family homes were the engine of Carson City’s market this month. Specifically, 76 homes closed in September, up 20.6% from August and 18.8% higher than a year ago. Total sales volume reached $68,364,082, showing strong demand across price points. On top of that, buyers moved quickly, with a median of just 14.5 days from listing to an accepted offer. The median days on market came in at 56 days, which covers the full closing process. Compared to last year, that figure is down 20.6%, so homes are selling noticeably faster than they did in 2025.
Pricing Trends
The median sale price for a single family home was $588,995, essentially flat from last month at -0.1%. However, the year-over-year story is much stronger, with prices up 7.1% since September 2025. The median price per square foot stood at $319.61. In addition, sellers received close to full asking price, with a sold-to-original-list ratio of 99.0%. That said, not every seller priced right the first time. About 25.0% of sales involved a price cut, with a median reduction of 3.3%, or $24,000. To put it simply, well-priced homes sell fast, while overpriced ones get trimmed.
Inventory and New Listings
New listings totaled 60 for the month, which trailed the 76 closed sales. As a result, inventory stayed tight, with 127 active listings and 70 homes pending. Months of supply fell to 1.7, down 13.9% from last month and 19.7% from a year ago. For context, anything under 3 months points to a seller’s market. Notably, cash buyers made up 22.4% of sales, showing plenty of buyers with strong financial footing.
What It Means for Buyers and Sellers
For sellers, this is a favorable moment. Homes priced correctly are drawing offers in about two weeks, and most sell near asking price. On the other hand, buyers face thin inventory and real competition, so pre-approval and quick decisions matter. Even so, the fact that one in four sellers had to cut their price shows buyers still have some leverage when a home is priced too high. Looking ahead, if new listings stay below sales, this tight market should continue into fall.
SFR Sales by Price Range
| Price Range | Sales | % of Total |
|---|---|---|
| Over $1M | 5 | 6.6% |
| $750K-$1M | 11 | 14.5% |
| $600K-$750K | 21 | 27.6% |
| $500K-$600K | 17 | 22.4% |
| $400K-$500K | 9 | 11.8% |
| $300K-$400K | 12 | 15.8% |
| Under $300K | 1 | 1.3% |
Condos & Townhomes
A Standout Year for Condos and Townhomes
The condo and townhome market delivered the most eye-catching numbers in Carson City this month. Specifically, the median sale price hit $406,490, up 3.2% from last month and a remarkable 19.7% from a year ago. In addition, 18 units closed, which is 125.0% more than September 2025, even though sales dipped 5.3% from August. Total volume reached $6,818,360. More importantly, sellers got full price on average, with a sold-to-original-list ratio of 100.0% — the only segment to hit that mark.
Market Timing and Pricing Strength
Condos took a bit longer to go under contract than single family homes, with a median of 22.0 days to an accepted offer. Still, the median days on market was 56.5 days, down a sharp 39.6% from last year. The median price per square foot was $256.22, making condos the more affordable path into this market. Meanwhile, price cuts were less common here than in the SFR segment. Only 22.2% of condo sales had a reduction, and the typical cut was smaller too, at 2.6% or $10,375. In contrast, SFR sellers who cut prices gave up $24,000 on average.
Inventory Is Razor Thin
Supply is the big concern for condo buyers. Only 10 new listings came on this month, while 18 units sold — meaning sales outpaced fresh supply nearly two to one. As a result, active listings sit at just 27, with 8 more pending. Months of supply dropped to 1.5, down 8.0% from last month and 29.6% from a year ago. Notably, cash sales were rare at just 5.6%, which suggests this segment is driven by financed buyers, likely first-timers and downsizers.
Takeaways for Condo Buyers and Sellers
For condo sellers, conditions could hardly be better. Prices are rising fast, homes sell at full asking, and competition from other listings is minimal. On the flip side, buyers face the tightest supply in the whole market, so patience and fast action are both needed. Because of this, buyers should watch new listings daily and be ready to move. Overall, condos are outperforming single family homes on price growth, making them worth a close look for value-minded shoppers.
Condo/Townhome Sales by Price Range
| Price Range | Sales | % of Total |
|---|---|---|
| Over $1M | 0 | 0.0% |
| $750K-$1M | 0 | 0.0% |
| $600K-$750K | 0 | 0.0% |
| $500K-$600K | 0 | 0.0% |
| $400K-$500K | 11 | 61.1% |
| $300K-$400K | 3 | 16.7% |
| Under $300K | 4 | 22.2% |
Financing Breakdown (All Properties)
| Loan Type | Sales | % of Total |
|---|---|---|
| Conventional | 50 | 53.2% |
| Cash | 18 | 19.1% |
| FHA | 13 | 13.8% |
| VA | 10 | 10.6% |
| Other | 2 | 2.1% |
| Private | 1 | 1.1% |
Carson City Real Estate Market Outlook – September 2026
Overall, Carson City remains a clear seller’s market, with just 1.6 months of supply across all home types and only 154 active listings against 78 pending sales. Sales are up sharply from last year, homes are selling near asking at 99.3% of original list, and buyers are committing within 16.0 days on average. Looking ahead, sellers should take advantage of low competition but price carefully, since 24.5% of sales still needed a cut. For buyers, acting quickly with solid financing is the key, and the condo segment offers a lower-cost entry point. Meanwhile, investors should note the 19.7% condo price surge as a sign of where demand is heading. In short, in Carson City right now, the homes aren’t waiting — and neither should you.
Thanks for reading our Carson City real estate market report for September 2026. We publish these updates monthly.
Have Questions About the Carson City Market?
Whether you are considering buying, selling, or simply trying to understand how current market conditions affect your home’s value, local data matters.
For a data-driven look at your specific neighborhood or property type, contact Guy Johnson, REALTOR® with Keller Williams Group One, Inc.
Guy Johnson, REALTOR®
Keller Williams Group One, Inc.
NV Lic. # S.75262.LLC
Phone: (775) 722-4011
Email: guyjohnson@kw.com