
Welcome to the June 2026 Incline Village real estate market report, covering Incline Village and Crystal Bay, Nevada. Below you’ll find median prices, closed sales, inventory, and days-on-market trends for single-family homes, condominiums, and PUDs.
Incline Village Real Estate Market Summary
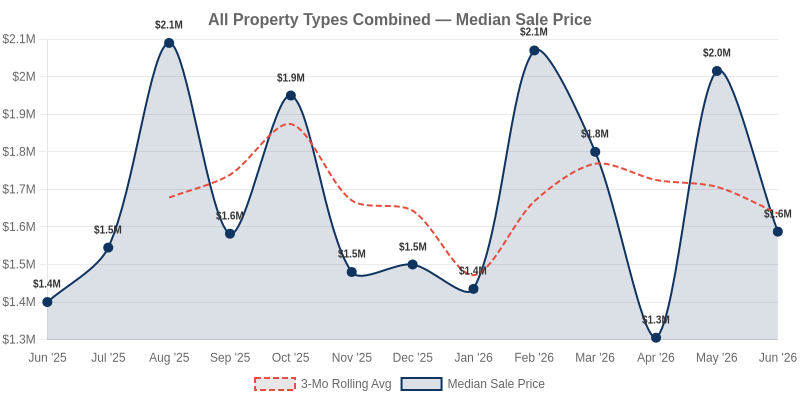
The Incline Village real estate market posted 40 closed sales in June 2026. Meanwhile, the combined median sale price reached $1,587,500. Total sales volume climbed to $92.1M across all property types. Additionally, active inventory expanded to 184 listings.
With 7.4 months of supply, conditions favor buyers over sellers. Homes took a median of 52 days to sell. Notably, single-family homes led the market with 21 sales at a $2,350,000 median. In contrast, condos offered more accessible entry points, closing 16 sales at a $707,500 median. As a result, buyers across segments may find added negotiating leverage this summer.
Single Family Residential
The Incline Village single-family market showed strong momentum in June 2026. Buyers closed 21 sales, up 10.5% from May. Meanwhile, total sales volume reached $73.4M, a striking 103.5% jump year-over-year. Clearly, high-end activity is driving the market.
The median sale price landed at $2,350,000 in June. However, that marks a 6.4% dip month-over-month. On the other hand, prices remain up a robust 34.3% compared to last year. Additionally, the average sale price soared 64.8% year-over-year to $3,496,143, reflecting more luxury closings.
Inventory climbed 13.5% to 84 active listings. Yet supply still sits 25.0% below year-ago levels. Notably, months of supply held steady at 5.7, down 47.2% year-over-year. As a result, conditions favor sellers, with homes fetching 98.1% of list price. However, new listings fell 28.9%, so buyers should act quickly on fresh options.
Condominium
The condominium market shifted notably in June 2026. Sales activity surged, with 16 closings recorded. That marks a 128.6% jump from the prior month. However, year-over-year sales held flat, unchanged from June 2025.
Meanwhile, prices pulled back sharply. The median sale price fell to $707,500, down 31.3% month-over-month. Additionally, it dropped 29.6% year-over-year. Notably, the average sale price declined 59.2% from May, suggesting a shift toward lower-priced units. As a result, median price per square foot settled at $610, off 7.4% from last year.
On the other hand, buyers moved faster this month. Median days on market fell to 44.5 days, down 51.1% month-over-month. Meanwhile, the sale-to-list ratio firmed to 98.3%. However, inventory remains ample at 84 active listings and 10.5 months of supply. In contrast, new listings dropped 44.1% from May. Buyers may still find leverage, but tightening supply could shift momentum ahead.
Planned Unit Development
The Planned Unit Development segment saw just 3 sales in June 2026. As a result, these metrics remain volatile and should be read with caution. Still, the median sale price climbed to $1,350,000. That marks a 16.7% jump year-over-year and a modest 1.9% gain month-over-month.
Meanwhile, the average sale price surged 37.0% from May to $1,814,667. Additionally, price per square foot rose to $937, up 30.0% year-over-year. However, sales activity remains thin, and total volume of $5.44M sits 37.0% below last June.
Notably, inventory expanded sharply, with active listings up 60.0% to 16 units. In contrast, new listings slipped 16.7% to just 5. Homes are also lingering longer, with median days on market reaching 112 days. Furthermore, the sale-to-list ratio eased to 94.9%. Therefore, buyers may find more negotiating leverage in this cooling segment.
Incline Village Real Estate Outlook
Looking ahead, the summer season should sustain the momentum we saw in June. Historically, buyer activity peaks between June and August in Tahoe. As a result, expect strong demand through the coming months. Sales already jumped 42.9% month-over-month, and that pace should hold.
Meanwhile, inventory climbed 10.8% to 184 active listings. This gives buyers more choices heading into peak season. However, months of supply sits at just 7.4, down 21.3% year-over-year. Notably, the sale-to-list ratio held at 98.2%, so sellers still command near-asking prices.
Segments will likely diverge in the near term. Single-family homes remain competitive, with only 5.7 months of supply. In contrast, condos carry 10.5 months of supply, favoring buyers. Therefore, condo shoppers may find more negotiating leverage this summer.
Investors should watch the year-over-year price gain of 13.4% carefully. Incline Village real estate continues to reward patient, long-term holders. Additionally, the sharp 21.2% monthly price drop reflects shifting mix, not weakening values. Overall, expect a balanced yet active market through late summer.
Want to see how the market is trending? Compare these numbers with last month’s Incline Village market report for May 2026.
Have Questions About the Incline Village and Lake Tahoe Market?
Whether you are considering buying, selling, or simply trying to understand how current market conditions affect your home’s value, local data matters.
For a data-driven look at your specific neighborhood or property type, contact Guy Johnson, REALTOR® with Keller Williams Group One, Inc.
Guy Johnson, REALTOR®
Keller Williams Group One, Inc.
NV Lic. # S.75262.LLC
Phone: (775) 722-4011
Email: guyjohnson@kw.com
Data Source: Incline Village REALTORS® via CoreLogic Matrix. Data deemed reliable but not guaranteed.
Methodology: Metrics are computed from MLS data for properties in Incline Village and Crystal Bay, NV. Months of Supply uses a trailing 3-month average of closed sales. Rolling averages use a 3-month simple moving average. Segments with fewer than 5 transactions are noted.
Report generated on July 12, 2026.
© 2026 Keller Williams Group One, Inc. All rights reserved.