
Welcome to the October 2026 Incline Village real estate market report, covering Incline Village and Crystal Bay, Nevada. Below you’ll find median prices, closed sales, inventory, and days-on-market trends for single-family homes, condominiums, and PUDs.
Incline Village Real Estate Market Summary
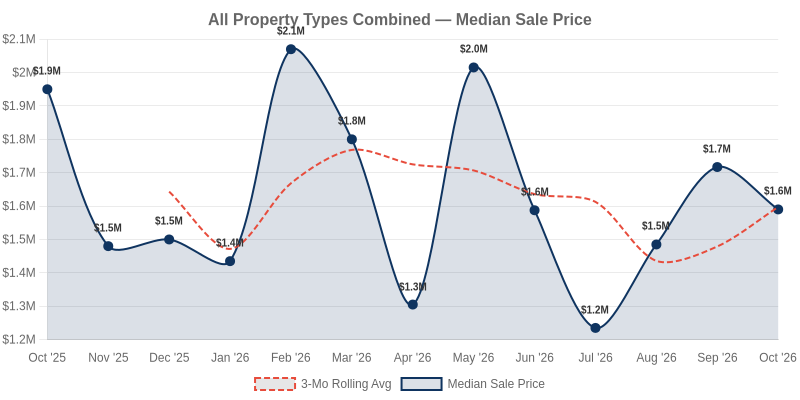
The Incline Village real estate market closed 31 sales in October 2026. That marks a 6.9% gain year-over-year. However, closings fell 29.5% month-over-month, reflecting typical autumn seasonal cooling.
Meanwhile, the combined median sale price landed at $1,590,000. That represents an 18.5% drop from a year ago. This decline likely reflects a shift in product mix toward more condo activity. Notably, condos accounted for 14 of the month’s sales, pulling the median lower. In contrast, total sales volume climbed 19.9% year-over-year to $79.8M, buoyed by stronger high-end single-family closings.
Additionally, active inventory tightened to 116 listings, down 21.6% year-over-year. As a result, months of supply held at 3.2, keeping sellers firmly in control. On the other hand, median days on market stretched to 76, up 30.3% from last year. Therefore, well-priced homes still move, while overpriced listings linger.
Single Family Residential
Incline Village’s single-family market posted a striking October. Notably, the median sale price surged to $3,810,000. That marks a 43.8% jump month-over-month and a 55.5% gain year-over-year. Meanwhile, buyers closed on 16 homes, down 15.8% from September.
Interestingly, the average sale price reached $3,745,375, which sits close to the median. As a result, this quarter’s price gains reflect genuine value appreciation, not a shift toward higher-end sales. Additionally, median price per square foot climbed to $1,007, up 7.6% year-over-year.
On the supply side, active inventory fell to 62 homes, down 27.9% from a year ago. With months of supply at 4, the market sits at the edge of balanced territory. However, the 98.7% sale-to-list ratio signals continued seller pricing power. Meanwhile, homes sold faster, with median days on market dropping to 73.5. Therefore, sellers remain firmly in control heading into winter.
Condominium
The condominium market delivered a median sale price of $980,000 in October. This marks a 7.5% dip month-over-month. However, prices remain up a strong 15.4% year-over-year. Meanwhile, the average sale price held nearly flat, slipping just 0.4% to $1,307,364.
Notably, inventory tightened considerably across the segment. Active listings fell 17.9% to 46 units. Additionally, months of supply dropped to just 2.4, down 29.4% from September. As a result, this remains firmly a seller’s market. New listings also pulled back sharply, declining 53.8% to only 6.
On the other hand, buyers gained some breathing room on timing. Median days on market climbed 37.3% to 97.5 days. Meanwhile, the sale-to-list ratio held at a healthy 96.4%, signaling continued seller pricing power. With only 14 sales closing, buyers should expect competition despite longer listing windows.
Planned Unit Development
The Planned Unit Development segment recorded just 1 sale in October 2026. As a result, this month’s metrics remain highly volatile. Buyers and sellers should interpret these numbers with caution.
Notably, the lone sale closed at $1,590,000, down 10.4% month-over-month. Year-over-year, the median price fell a steep 33.1%. However, with such a small sample, these swings likely reflect property mix rather than true market decline.
Meanwhile, months of supply sits at 3.4, which still favors sellers. Additionally, the sale-to-list ratio hit a perfect 100%, signaling firm pricing power. On the other hand, new listings dropped 33.3% month-over-month, leaving active inventory at 8 units. Consequently, well-priced sellers continue to hold the advantage despite thin activity.
Incline Village Real Estate Outlook
Looking ahead, sellers continue to hold the upper hand across most of the market. Months of supply sits at just 3.2, firmly in seller territory. Meanwhile, the sale-to-list ratio of 97.9% confirms strong pricing discipline. However, inventory has tightened sharply, down 21.6% year-over-year. As a result, buyers will likely face limited choices heading into winter.
Seasonally, Incline Village real estate typically slows through the colder months. Additionally, sales already dropped 29.5% month-over-month, signaling the usual autumn cooldown. Notably, the median price fell 18.5% year-over-year, which may reflect changing buyer activity rather than broad weakness. On the other hand, longer median days on market of 76 give patient buyers some room to negotiate. Investors should watch the condo segment closely, where supply remains very tight at 2.4 months. In contrast, the single-family segment sits near balance at 4 months, offering slightly more flexibility.
Want to see how the market is trending? Compare these numbers with last month’s Incline Village market report for September 2026.
Have Questions About the Incline Village and Lake Tahoe Market?
Whether you are considering buying, selling, or simply trying to understand how current market conditions affect your home’s value, local data matters.
For a data-driven look at your specific neighborhood or property type, contact Guy Johnson, REALTOR® with Keller Williams Group One, Inc.
Guy Johnson, REALTOR®
Keller Williams Group One, Inc.
NV Lic. # S.75262.LLC
Phone: (775) 722-4011
Email: guyjohnson@kw.com
Data Source: Incline Village REALTORS® via CoreLogic Matrix. Data deemed reliable but not guaranteed.
Methodology: Metrics are computed from MLS data for properties in Incline Village and Crystal Bay, NV. Months of Supply uses a trailing 3-month average of closed sales. Rolling averages use a 3-month simple moving average. Segments with fewer than 5 transactions are noted.
Report generated on November 9, 2026.
© 2026 Keller Williams Group One, Inc. All rights reserved.
Get the monthly market reports by email
Reno/Sparks, Carson City, and Incline Village numbers, sent to your inbox when each new report is out. I'll only email you when I publish something new, and you can unsubscribe anytime. — Guy