
Here is our Reno/Sparks real estate market report for July 2026 — a data-driven look at home prices, sales, inventory, and market speed across the region.
Browse our past Reno/Sparks market reports.
Market Snapshot (SFRs and Condo/Townhomes)
The Reno/Sparks market stayed hot in July 2026, with 584 homes sold for a total of $406,719,310. The median sale price landed at $569,500, up 3.5% from a year ago, even though it dipped -4.4% from last month. With just 1.9 months of supply, sellers still hold the upper hand across the region.
🏠 Single Family Residences
Pricing and Sales Volume
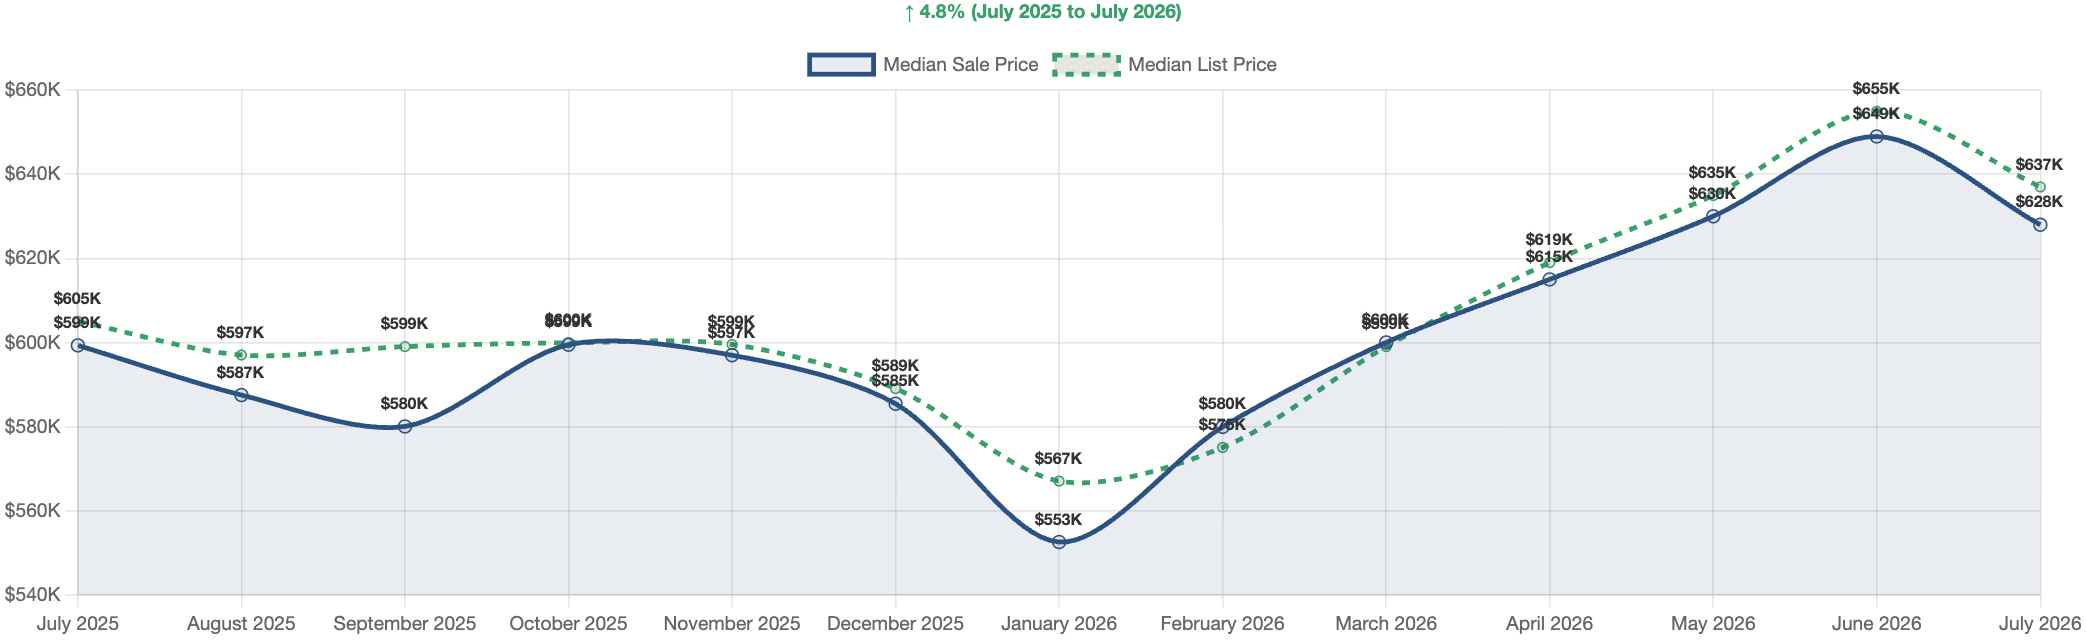
Single family homes told a story of steady strength this July. The median sale price came in at $628,000, which is 4.8% higher than the same month last year. That said, prices slipped -3.2% from June, which is a normal summer cooldown rather than a warning sign. Buyers closed on 466 homes, adding up to $360,789,427 in total volume. Notably, sales were up 11.2% compared to last July, showing that demand keeps growing year over year. The median price per square foot was $341.88, and homes sold at 99.8% of their original asking price. In short, sellers got almost exactly what they asked for.
Market Timing and Seller Activity
Homes are moving fast. The median days to contract was just 14.0 days, meaning most sellers had an accepted offer in about two weeks. Meanwhile, total days on market came in at 48, down -5.9% from last month and -17.2% from a year ago. On the supply side, sellers listed 537 new homes in July. Because of this steady flow of fresh listings, buyers had more choices than they did earlier in the year. Even so, demand kept pace, with 508 homes sitting in pending status by month’s end.
Inventory and Price Reductions
Active listings stood at 862, which works out to 1.9 months of supply. That number rose 11.4% from June, yet it remains -32.0% lower than a year ago. To put it simply, anything under three months of supply favors sellers, and this market is well below that line. Still, not every seller priced their home right. Specifically, 26.8% of sales needed a price cut before finding a buyer, with a median reduction of 3.5%, or about $25,000. For sellers, the lesson is clear: price well from day one. For buyers, the takeaway is to move quickly on well-priced homes but watch for listings that have sat awhile, since those sellers may be open to a deal.
SFR Sales by Price Range
| Price Range | Sales | % of Total |
|---|---|---|
| Over $1M | 81 | 17.4% |
| $750K-$1M | 80 | 17.2% |
| $600K-$750K | 97 | 20.8% |
| $500K-$600K | 109 | 23.4% |
| $400K-$500K | 85 | 18.2% |
| $300K-$400K | 13 | 2.8% |
| Under $300K | 1 | 0.2% |
🏢 Condos & Townhomes
Sales Activity and Pricing
Condos and townhomes were the surprise star of July. The median sale price hit $349,500, up 2.8% from last month and a striking 11.0% from a year ago. In contrast, single family prices dipped month over month, so condos clearly bucked the trend. Buyers closed 118 sales for a total of $45,929,883, and sales grew 28.3% year over year. On top of that, the median price per square foot was $283.85, and units sold at 98.8% of their original list price. This segment offers a lower entry point, and buyers are clearly taking notice.
Timing, Listings, and Inventory
Condos take a bit longer to sell than houses, but the gap is shrinking. The median days to contract was 26.0, and total days on market was 55. Notably, that market time dropped -14.1% from June and -30.8% from last July. Sellers added 110 new listings, nearly matching the 118 closed sales, which keeps supply tight. As a result, active listings sat at 228 with 99 pending, and months of supply held at 1.9 months. Furthermore, supply actually fell -4.0% from last month, while single family supply grew. That is a small but telling difference between the two markets.
Price Cuts and Cash Buyers
Price reductions were a bit more common here than with houses. Specifically, 31.4% of condo sales needed a cut, compared to 26.8% for single family homes. However, the cuts were smaller in dollar terms, with a median drop of $11,000, or 3.8%. Another key difference is cash. In this segment, 40.7% of sales were all-cash deals, far above the 25.8% seen in the single family market. Because of this, buyers using loans should come in with strong offers and clean terms. For sellers, the message is upbeat: prices are rising, buyers are active, and well-priced units are moving faster than they have in over a year.
Condo/Townhome Sales by Price Range
| Price Range | Sales | % of Total |
|---|---|---|
| Over $1M | 3 | 2.5% |
| $750K-$1M | 0 | 0.0% |
| $600K-$750K | 1 | 0.8% |
| $500K-$600K | 11 | 9.3% |
| $400K-$500K | 23 | 19.5% |
| $300K-$400K | 41 | 34.7% |
| Under $300K | 39 | 33.1% |
Financing Breakdown (All Properties)
| Loan Type | Sales | % of Total |
|---|---|---|
| Conventional | 296 | 50.7% |
| Cash | 168 | 28.8% |
| FHA | 76 | 13.0% |
| VA | 29 | 5.0% |
| Other | 11 | 1.9% |
| Private | 3 | 0.5% |
| Seller Financed | 1 | 0.2% |
Sales by City
| City | Sales | Median Price |
|---|---|---|
| Sparks | 164 | $545,000 |
| Reno | 420 | $605,000 |
Reno/Sparks Real Estate Market Outlook – July 2026
Overall, Reno/Sparks remains a firm seller’s market, with just 1.9 months of supply across both home types. Prices are up year over year, homes are selling faster than they did last summer, and buyer demand keeps climbing, as shown by the 14.3% jump in closed sales. That said, more than a quarter of sellers needed price cuts, so pricing right still matters. Looking ahead, buyers should expect competition but can find leverage on homes that linger. Sellers should list with confidence, while investors may want a close look at condos, where prices rose 11.0% and cash is king. In short, this market rewards those who act with good data and a smart plan — speed and pricing win the day in Reno/Sparks.
Thanks for reading our Reno/Sparks real estate market report for July 2026. We publish these updates monthly.
Have Questions About the Reno/Sparks Market?
Whether you are considering buying, selling, or simply trying to understand how current market conditions affect your home’s value, local data matters.
For a data-driven look at your specific neighborhood or property type, contact Guy Johnson, REALTOR® with Keller Williams Group One, Inc.
Guy Johnson, REALTOR®
Keller Williams Group One, Inc.
NV Lic. # S.75262.LLC
Phone: (775) 722-4011
Email: guyjohnson@kw.com