
Here is our Reno/Sparks real estate market report for September 2026 — a data-driven look at home prices, sales, inventory, and market speed across the region.
How does this compare? Read last month’s Reno/Sparks market report.
Market Snapshot (SFRs and Condo/Townhomes)
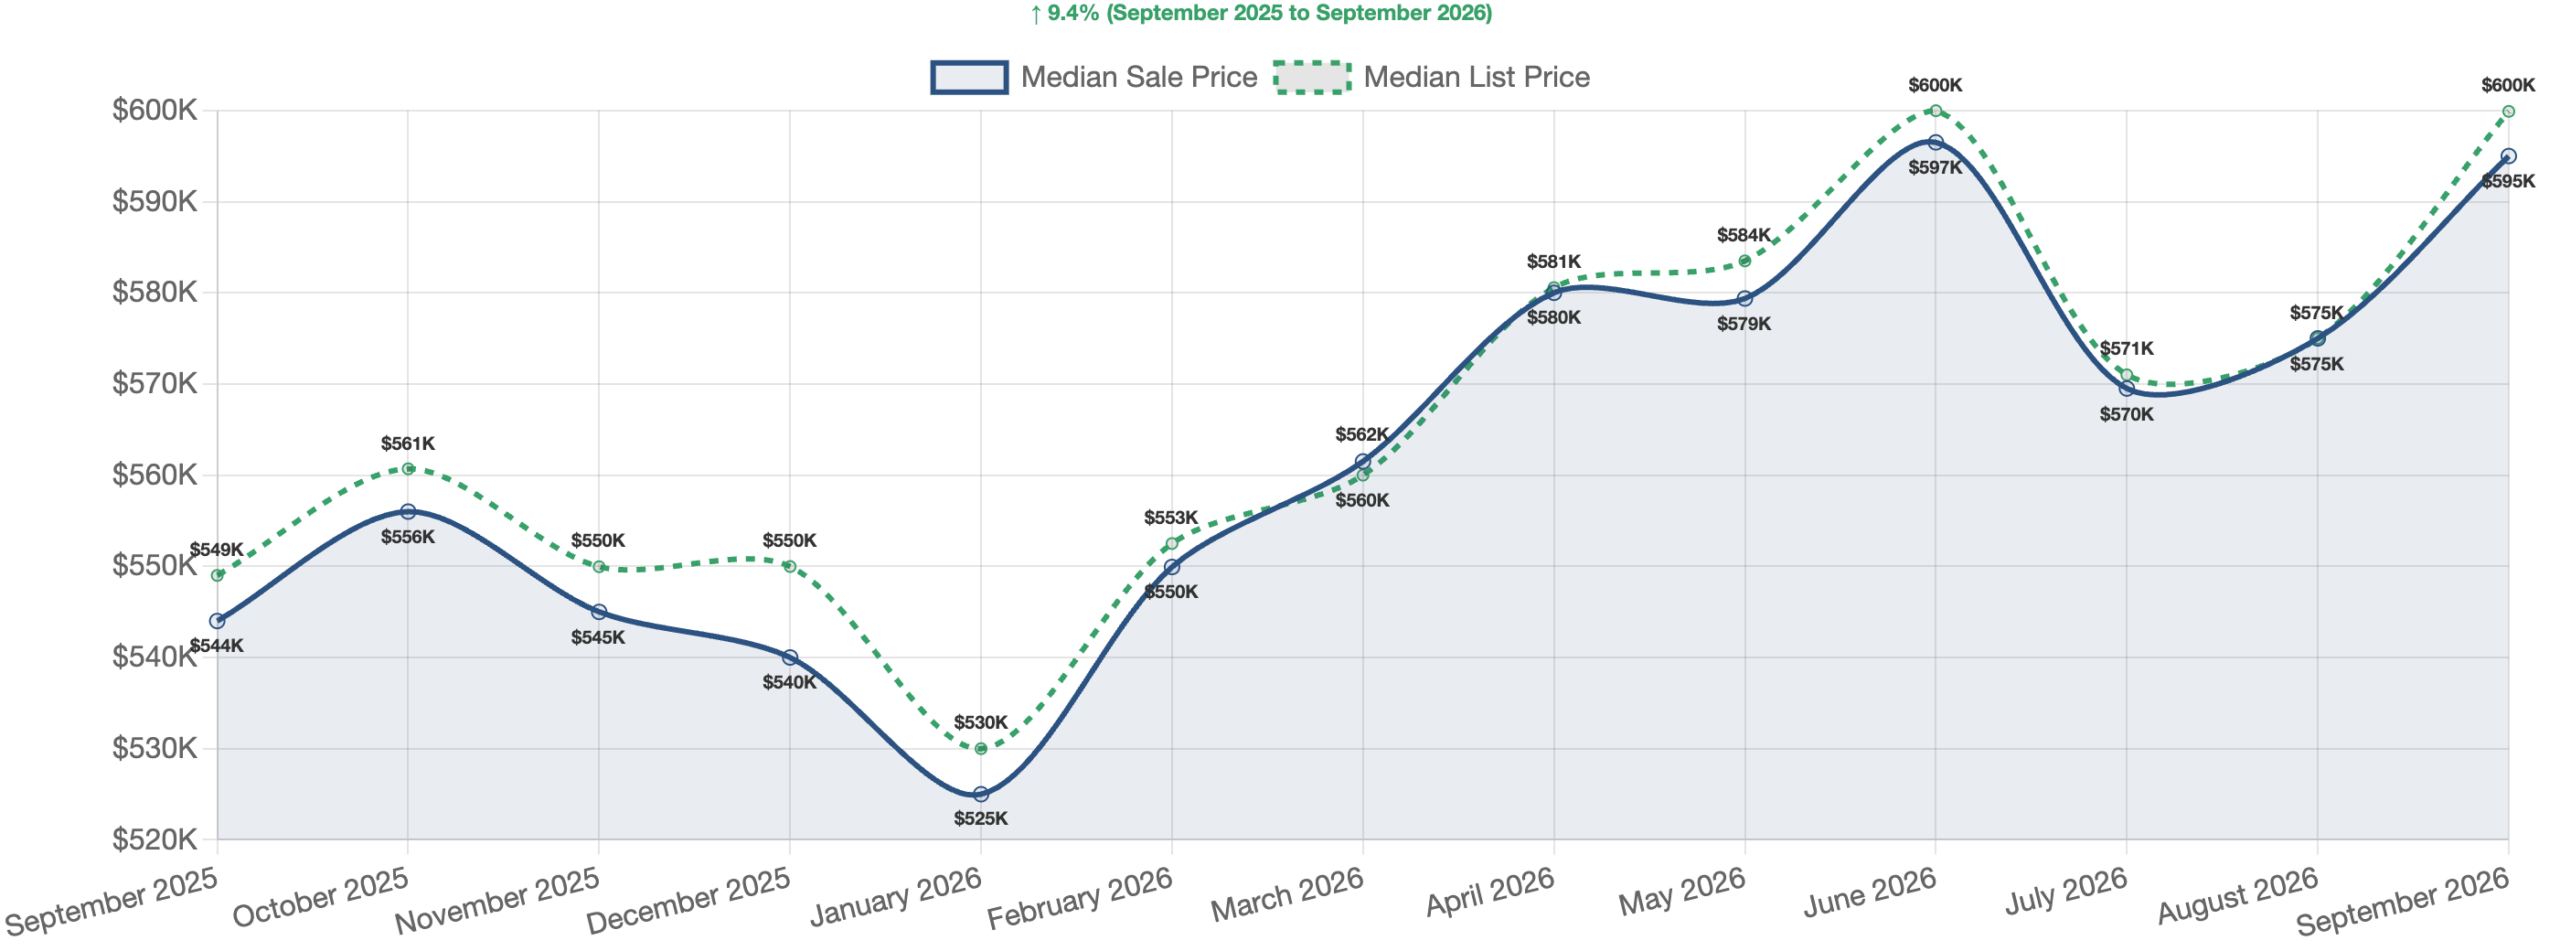
The Reno/Sparks housing market stayed in sellers’ hands this September, with the median sale price climbing to $595,000 — up 9.4% from a year ago. However, buyers did slow down a bit, as closed sales dipped 4.6% from last month to 460 homes. With just 2.4 months of supply, demand still outpaces what’s available, even as 40.4% of sellers had to cut their price to get a deal done.
Single Family Residences
Prices Keep Climbing
The big story for single family homes this month is price strength. The median sale price hit $640,000, up 3.2% from last month and a notable 10.3% higher than a year ago. In addition, the median price per square foot reached $334.71. Sellers are also getting close to their asking price, with homes selling at 98.1% of the original list price. To put it simply, well-priced homes are still fetching strong offers in this market.
Sales Volume and Market Timing
Buyers closed on 387 single family homes in September, adding up to $305,743,541 in total sales. That’s nearly flat from last month, down just 0.3%. However, sales are off 6.3% compared to this time last year. Meanwhile, homes took a median of 59 days to sell, though buyers moved fast on the front end — the median time to an accepted offer was only 26 days. Notably, that 59-day figure is 9.2% faster than a year ago, even though it crept up 5.4% from last month.
Inventory and Seller Activity
Sellers brought 415 new listings to market, which shows steady confidence on their end. At the same time, active listings stand at 884 with 422 homes already pending. That works out to just 2.3 months of supply — firmly in seller’s market territory. Furthermore, supply is down 3.4% from a year ago, so buyers aren’t getting much relief on choices.
Price Cuts and What It Means for You
That said, sellers can’t price carelessly. About 41.1% of sold homes needed a price cut first, with a median reduction of $25,100, or 4.0%. For sellers, the lesson is clear: price it right from day one, because buyers are rewarding realistic listings. On the flip side, buyers should move quickly on fresh, well-priced homes, since the best ones go under contract in under a month. Also worth noting, 25.3% of sales were all cash, so financed buyers face some stiff competition.
SFR Sales by Price Range
| Price Range | Sales | % of Total |
|---|---|---|
| Over $1M | 58 | 15.0% |
| $750K-$1M | 65 | 16.8% |
| $600K-$750K | 97 | 25.1% |
| $500K-$600K | 89 | 23.0% |
| $400K-$500K | 67 | 17.3% |
| $300K-$400K | 10 | 2.6% |
| Under $300K | 1 | 0.3% |
Condos & Townhomes
A Sharp Monthly Price Swing
Condos and townhomes told a bumpier story this month. The median sale price dropped to $316,000, a steep 14.7% slide from last month. However, don’t read too much into one month — prices are still up 3.6% from a year ago, and smaller sales counts can swing the median a lot. For example, just 73 condos and townhomes closed in September, down 22.3% from last month and 16.1% from last year. Total sales volume came in at $29,763,803, with a median price per square foot of $285.23.
Timing and New Listings
Despite the slower sales, condos actually moved a touch faster than houses. The median days on market was 54, down 3.6% from last month and a striking 37.9% faster than a year ago. Similarly, the median time to an accepted offer was just 25 days. Meanwhile, sellers listed 111 new condos and townhomes — a healthy flow that outpaced closings. Because of this, buyers in this segment are seeing a bit more to choose from.
Inventory, Price Cuts, and the Takeaway
Active listings sit at 232, with 96 pending. That puts supply at 3.2 months — up 20.5% from last month and now edging into balanced territory, unlike the tighter SFR market. In contrast, only 37.0% of condo sales needed a price cut, slightly fewer than houses, with a smaller median cut of $15,000. Also, cash is a bigger force here: 35.6% of condo sales were all cash, well above the 25.3% seen for houses. Overall, condo buyers have a little more breathing room and leverage right now, while sellers should price sharply and expect pickier shoppers. For investors, the strong cash activity shows this segment remains a popular target.
Condo/Townhome Sales by Price Range
| Price Range | Sales | % of Total |
|---|---|---|
| Over $1M | 2 | 2.7% |
| $750K-$1M | 2 | 2.7% |
| $600K-$750K | 0 | 0.0% |
| $500K-$600K | 5 | 6.8% |
| $400K-$500K | 14 | 19.2% |
| $300K-$400K | 21 | 28.8% |
| Under $300K | 29 | 39.7% |
Financing Breakdown (All Properties)
| Loan Type | Sales | % of Total |
|---|---|---|
| Conventional | 237 | 51.5% |
| Cash | 124 | 27.0% |
| FHA | 52 | 11.3% |
| VA | 39 | 8.5% |
| Other | 4 | 0.9% |
| Private | 3 | 0.7% |
| Assumed | 1 | 0.2% |
Sales by City
| City | Sales | Median Price |
|---|---|---|
| Reno | 323 | $640,000 |
| Sparks | 137 | $569,000 |
Reno/Sparks Real Estate Market Outlook – September 2026
Overall, Reno/Sparks remains a seller’s market, but the edge is softening in spots. With 2.4 months of supply market-wide — and single family homes even tighter at 2.3 months — sellers still hold the advantage, while condos are drifting toward balance at 3.2 months. Looking ahead, buyers should watch the condo segment for better deals and negotiate confidently when a listing has sat past a month. Sellers, meanwhile, need sharp pricing, since 4 in 10 homes required a cut before selling. For investors, strong cash activity and rising prices suggest confidence in the area’s long-term growth. In short, this is a market that rewards preparation: homes priced right still sell fast and near asking, while the overpriced ones sit — and pay for it.
Thanks for reading our Reno/Sparks real estate market report for September 2026. We publish these updates monthly.
Have Questions About the Reno/Sparks Market?
Whether you are considering buying, selling, or simply trying to understand how current market conditions affect your home’s value, local data matters.
For a data-driven look at your specific neighborhood or property type, contact Guy Johnson, REALTOR® with Keller Williams Group One, Inc.
Guy Johnson, REALTOR®
Keller Williams Group One, Inc.
NV Lic. # S.75262.LLC
Phone: (775) 722-4011
Email: guyjohnson@kw.com