Agent Insights
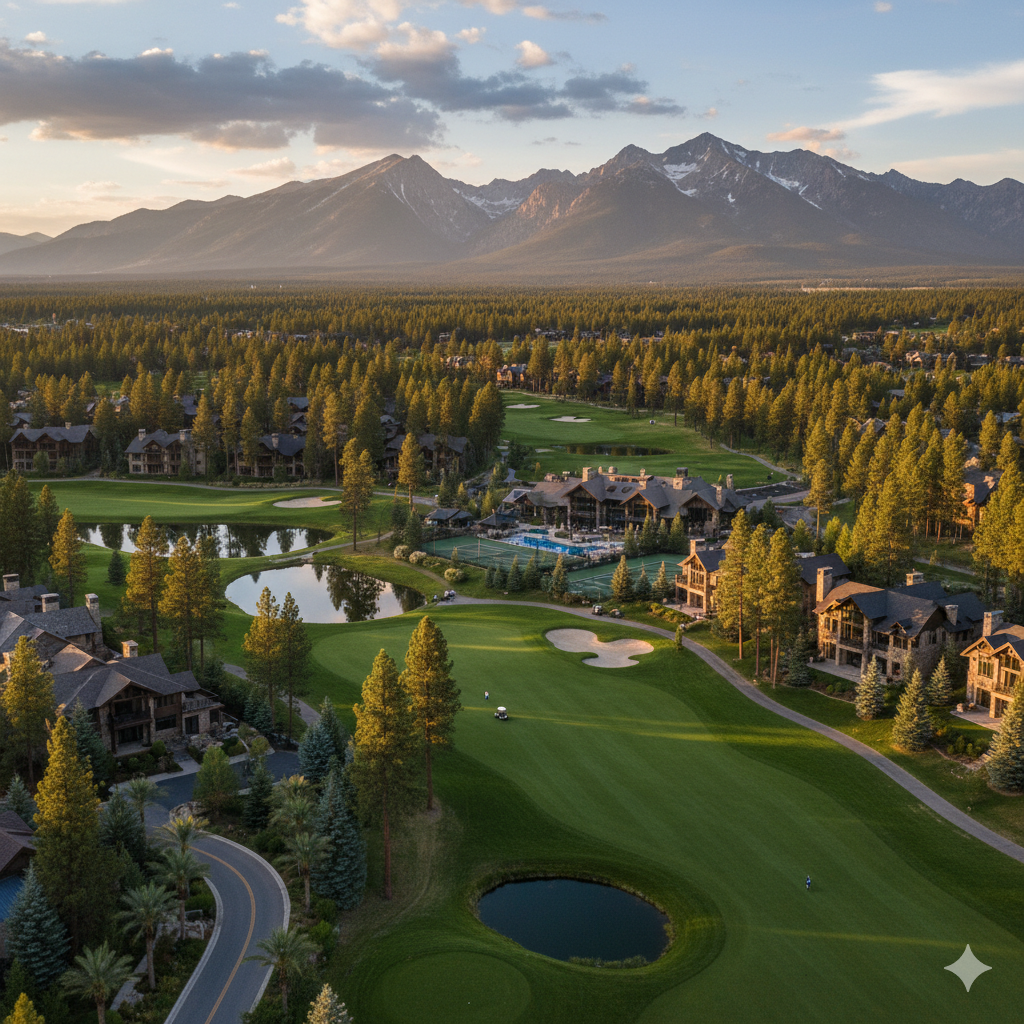
Somersett, ArrowCreek, or Montreux? (2025 Update)
Why We’re Revisiting This Post It’s hard to believe, but this comparison between Somersett, ArrowCreek, and Montreux was first published on the Reno Realty Blog

Why We’re Revisiting This Post It’s hard to believe, but this comparison between Somersett, ArrowCreek, and Montreux was first published on the Reno Realty Blog

With the Reno City Council’s adoption of an Accessory Dwelling Unit (ADU) ordinance on October 8, 2025, many homeowners are asking a practical question: Where
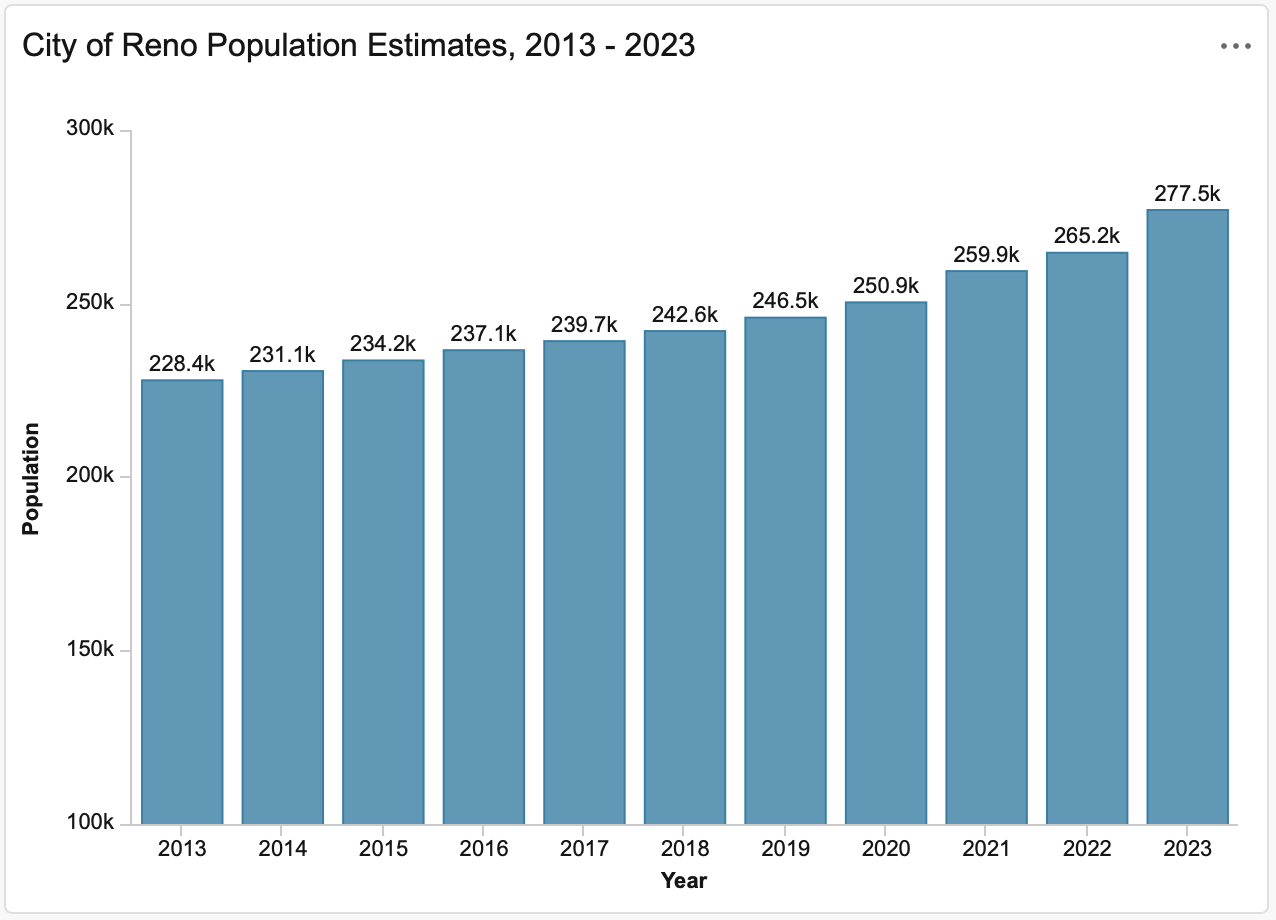
The City of Reno’s Department of Housing & Neighborhood Development has released a new Housing Dashboard—an interactive tool designed to give residents, policymakers, and real
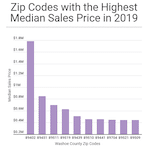
One of this blog’s most frequently searched-for topics is “home sales by zip code”. As such, each January, I post an analysis of the prior
Check out today’s Reno Gazette Journal’s piece on Reno-Sparks’ affordable housing crisis. This deep-dive analysis is worth the read: Reno-Sparks has an affordable housing crisis.
The table below shows the 2015 4th-quarter median sales prices for houses throughout the Reno and Sparks, Nevada metropolitan area, broken out by zip code.
On a quarter-over-quarter basis, the median sales price for houses in the Reno-Sparks market increased a little over 10 percent in 2015 [4th-quarter 2014 median
On a quarter-over-quarter basis, the median sales price for houses and condos in the Reno-Sparks market increased nearly 17 percent in 2014 [4th-quarter 2014 median