
Here is our Carson City real estate market report for October 2026 — a data-driven look at home prices, sales, inventory, and market speed across the region.
How does this compare? Read last month’s Carson City market report.
Market Snapshot (SFRs and Condo/Townhomes)
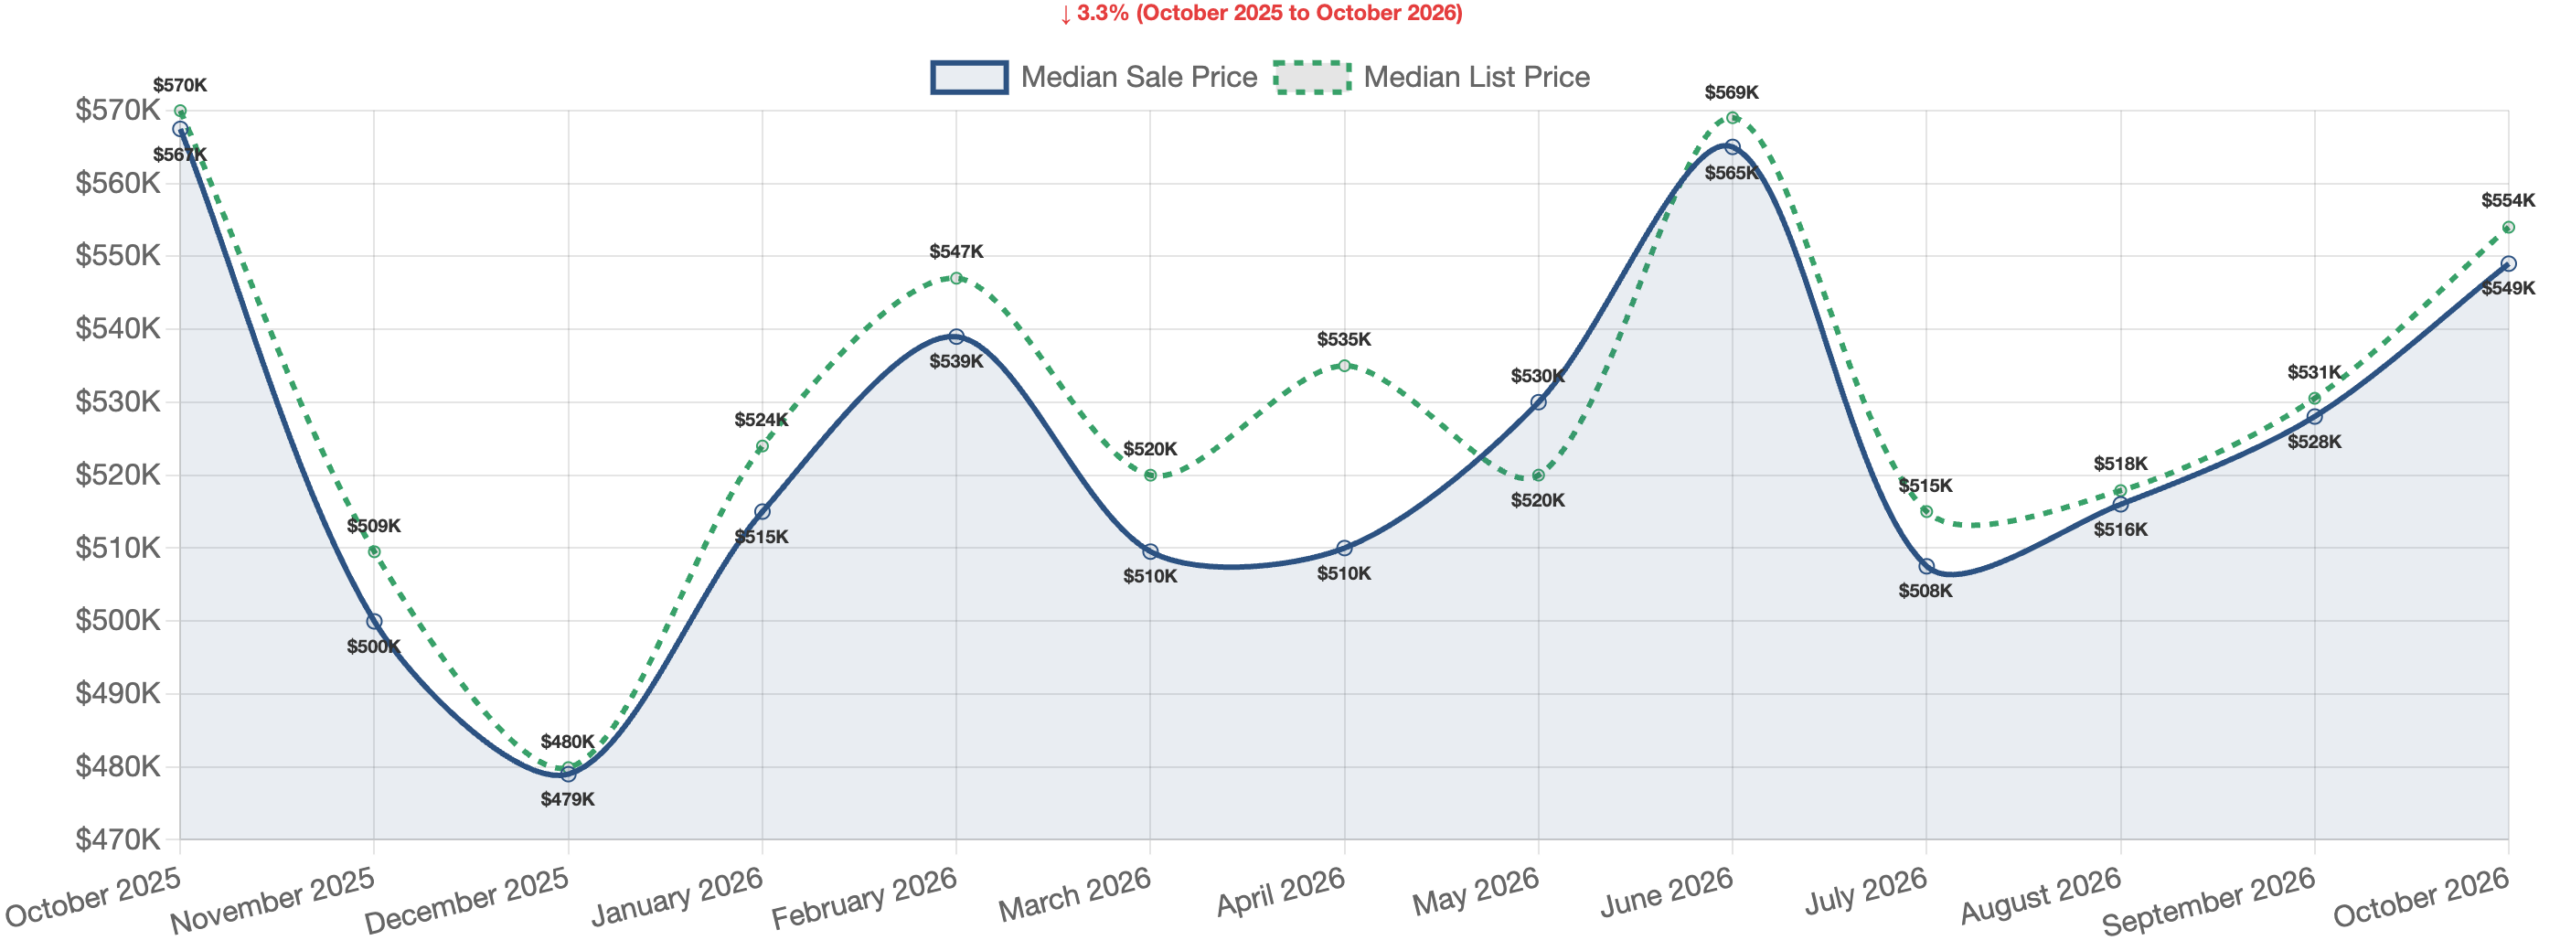
Carson City’s housing market cooled in October 2026, with 64 closed sales — a drop of 31.9% from the month before and 13.5% from a year ago. The overall median sale price rose 4.0% to $548,995, but that reflects the mix of homes sold: fewer lower-priced condos closed, while the single family and condo medians both slipped. Months of supply sits at just 2.3, which still keeps sellers in control. In short, fewer deals are closing, and prices are edging lower beneath the headline number.
Single Family Residences
The Big Picture for Single Family Homes
The key story for single family homes this month is a slowdown in sales paired with softer prices. Specifically, 54 homes closed in October, down 28.9% from last month and 10.0% from last year. The median sale price landed at $580,000, a dip of 1.5% from the prior month and 4.8% below a year ago. Meanwhile, total sales volume came in at $50,703,600, and the median price per square foot was $316.21. Sellers are still getting close to their asking price, with a sold-to-original-list ratio of 97.7%. That said, the price slide over the past year shows buyers have gained some room to negotiate.
Market Timing and Seller Activity
Homes are taking longer to sell. The median days on market hit 68.5, up 22.3% from last month. However, the median time to get an offer accepted was just 24.0 days, which means well-priced homes still move fast while others sit. On the listing side, 52 new homes came to market in October. As a result, fresh supply roughly matched closed sales, so sellers are staying active but not flooding the market. Compared to a year ago, days on market are actually down 6.8%, so homes are moving a bit quicker than last fall.
Inventory and Price Cuts
Active listings stand at 123, with another 69 homes pending. That works out to 2.3 months of supply, which still favors sellers. Even so, months of supply jumped 36.5% from last month and 10.1% from a year ago, mostly because fewer homes sold; active listings actually dipped. On top of that, price cuts are becoming more common. In particular, 29.6% of October sales involved a price reduction, with a median cut of 3.9%, or $25,000. That tells us nearly one in three sellers had to adjust their price to find a buyer. Notably, cash buyers made up 42.6% of sales, a sign that investors and equity-rich buyers remain a big force here.
What This Means for Buyers and Sellers
For buyers, the picture is improving. More months of supply, softer prices, and more frequent price cuts all add leverage at the negotiating table. On the other hand, sellers should price realistically from day one. Because of this market shift, overpriced homes risk sitting past 68.5 days and ending up with a $25,000 reduction. To put it simply, accurate pricing is the difference between a quick sale and a long wait.
SFR Sales by Price Range
| Price Range | Sales | % of Total |
|---|---|---|
| Over $1M | 3 | 5.6% |
| $750K-$1M | 11 | 20.4% |
| $600K-$750K | 10 | 18.5% |
| $500K-$600K | 12 | 22.2% |
| $400K-$500K | 14 | 25.9% |
| $300K-$400K | 3 | 5.6% |
| Under $300K | 1 | 1.9% |
Condos & Townhomes
Sales Activity and Pricing
Condos and townhomes saw a sharp pullback in October. Only 10 units closed, down 44.4% from last month and 28.6% from a year ago. The median sale price fell to $287,500, a steep 29.3% drop from the prior month. However, that big swing likely reflects a shift in which units sold rather than a true crash in values — the year-over-year change is a much milder -1.7%. Total volume reached $2,868,990, with a median price per square foot of $251.40. Also worth noting, sellers captured 98.2% of their original asking price, slightly better than single family homes.
Speed, Listings, and Inventory
Despite fewer sales, condos that did sell moved quickly. The median days on market was 40, down 29.2% from last month and 52.9% from a year ago. More importantly, the median days to contract was just 5.5 — buyers are pouncing on well-priced units within the first week. Meanwhile, only 8 new listings hit the market, so seller activity is thin. Active listings total 26, with 7 pending, which puts months of supply at 2.6. That said, months of supply has climbed fast, up 73.3% from last month and 101.6% from a year ago, as sales fell, though it remains in seller’s market territory.
How Condos Differ from Single Family Homes
Price cuts tell a very different story here. Only 10.0% of condo sales had a reduction, compared to 29.6% for single family homes, and the median cut was just 1.8%, or $5,250. In contrast to the SFR market, condo sellers are mostly holding their prices. Furthermore, cash sales made up only 20.0% of closings versus 42.6% for houses, which suggests more condo buyers are financing their purchase. For buyers, the lower price point at $287,500 keeps condos the most affordable entry into Carson City. For sellers, the message is simple: demand is quick and firm, but the shrinking sales count means pricing right still matters.
Condo/Townhome Sales by Price Range
| Price Range | Sales | % of Total |
|---|---|---|
| Over $1M | 0 | 0.0% |
| $750K-$1M | 0 | 0.0% |
| $600K-$750K | 0 | 0.0% |
| $500K-$600K | 0 | 0.0% |
| $400K-$500K | 1 | 10.0% |
| $300K-$400K | 4 | 40.0% |
| Under $300K | 5 | 50.0% |
Financing Breakdown (All Properties)
| Loan Type | Sales | % of Total |
|---|---|---|
| Cash | 25 | 39.1% |
| Conventional | 22 | 34.4% |
| VA | 9 | 14.1% |
| FHA | 7 | 10.9% |
| Other | 1 | 1.6% |
Carson City Real Estate Market Outlook – October 2026
Overall, Carson City remains a seller’s market by the numbers, with 2.3 months of supply and 149 active listings across all home types. Still, the trend is shifting — months of supply is rising, sales are slowing, and more sellers are cutting prices. For context, the national average 30-year fixed mortgage rate from Freddie Mac was 7.33% in October, up from 6.86% the month before and 6.25% a year ago, with the latest weekly reading at 7.18%. Consequently, higher financing costs may weigh on new contracts and pending activity in the near term. Looking ahead, buyers should watch for growing leverage, sellers should price sharply from the start, and investors may find value in the condo segment’s quick 5.5-day contract times. In short, the market still favors sellers — but the gap is narrowing with every month.
Thanks for reading our Carson City real estate market report for October 2026. We publish these updates monthly.
Have Questions About the Carson City Market?
Whether you are considering buying, selling, or simply trying to understand how current market conditions affect your home’s value, local data matters.
For a data-driven look at your specific neighborhood or property type, contact Guy Johnson, REALTOR® with Keller Williams Group One, Inc.
Guy Johnson, REALTOR®
Keller Williams Group One, Inc.
NV Lic. # S.75262.LLC
Phone: (775) 722-4011
Email: guyjohnson@kw.com
Get the monthly market reports by email
Reno/Sparks, Carson City, and Incline Village numbers, sent to your inbox when each new report is out. I'll only email you when I publish something new, and you can unsubscribe anytime. — Guy