
Here is our Reno/Sparks real estate market report for October 2026 — a data-driven look at home prices, sales, inventory, and market speed across the region.
How does this compare? Read last month’s Reno/Sparks market report.
Market Snapshot (SFRs and Condo/Townhomes)
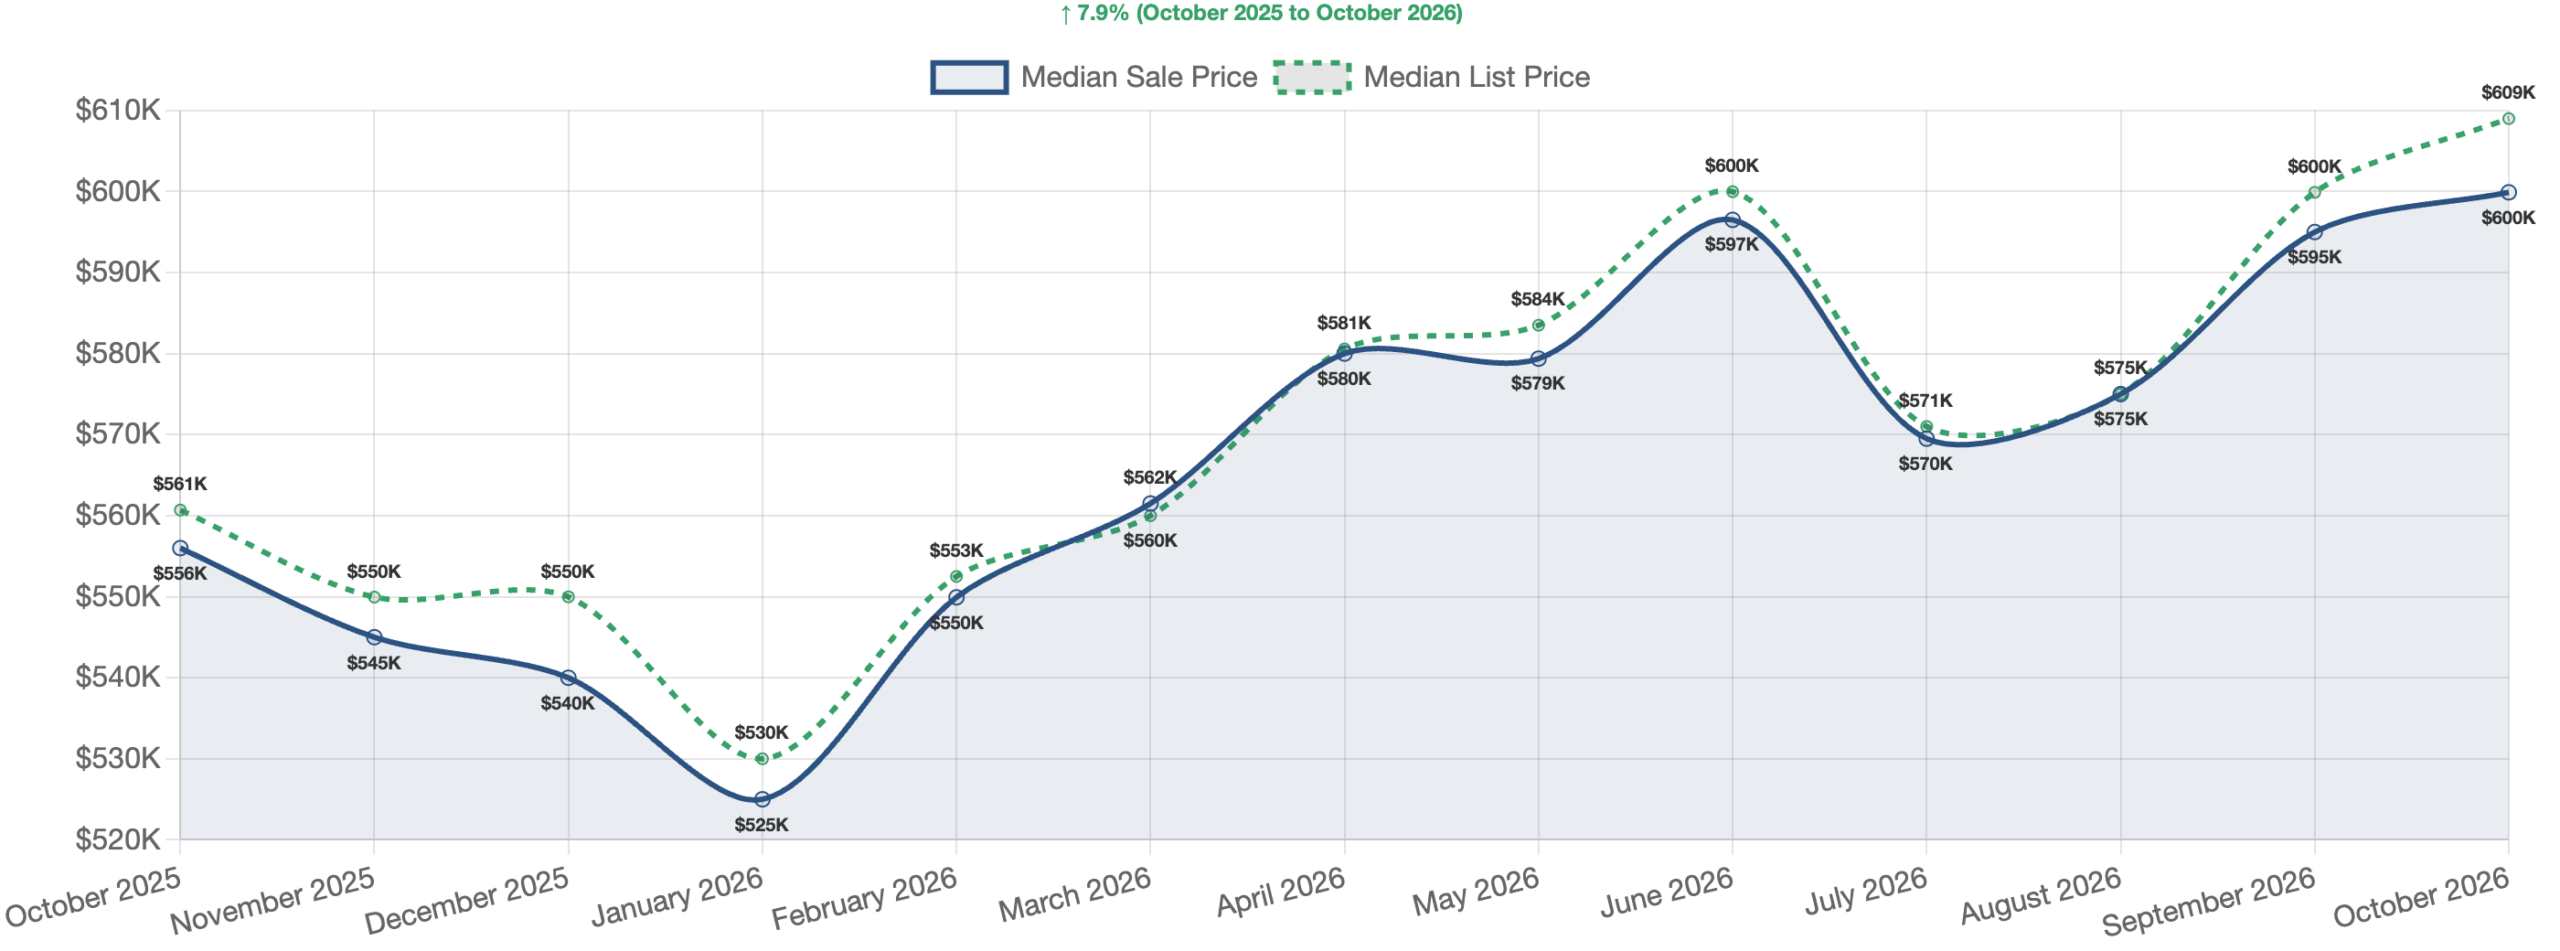
Reno/Sparks home prices kept climbing in October 2026, with the overall median sale price hitting $599,900 — up 7.9% from a year ago. However, closed sales dropped to 433, down 11.5% year-over-year. Notably, Freddie Mac’s national 30-year fixed rate averaged 7.33% in October, up from 6.86% the prior month and 6.25% a year ago, which likely weighed on new contracts and pending sales rather than this month’s closings.
Single Family Residences
The Big Picture for Single Family Homes
The key story for single family homes this month is simple: prices are up, but sales are down. The median sale price reached $645,000, a gain of 0.8% from last month and 7.6% from a year ago. Meanwhile, closed sales fell to 357 homes, down 8.0% month-over-month and 13.3% from last October. In short, fewer homes changed hands, yet the ones that sold brought strong prices. Total sales volume still reached $295,388,768, and the median price per square foot came in at $339.72.
Market Timing and Seller Activity
Homes took a median of 58 days to sell, which is nearly flat from last month. More importantly, that figure is down 22.7% from a year ago, so homes are moving faster than they did last fall. The median time to get an accepted offer was just 27.5 days. On the seller side, 365 new listings hit the market, which almost matched the 357 closed sales. As a result, fresh supply is roughly keeping pace with demand, and sellers still seem willing to list despite slower sales.
Inventory and Price Reductions
Active listings stood at 866, with 364 homes pending. That works out to 2.4 months of supply, which still favors sellers. Even so, supply rose 6.6% from last month, so buyers are slowly gaining a bit more choice. That said, sellers should not get too comfortable. Specifically, 39.5% of sales involved a price cut, with a median reduction of 3.7%, or about $24,950. In addition, homes sold at 98.1% of their original list price, so most sellers gave up a little at the finish line.
What It Means for Buyers and Sellers
For sellers, pricing right from day one matters more than ever. Because of this, homes priced correctly are going under contract in under a month, while overpriced homes face cuts near $24,950. For buyers, the picture is mixed. On one hand, tight supply at 2.4 months keeps pressure on prices. On the other hand, nearly four in ten sellers cut their price, so there is real room to negotiate. With that in mind, patient buyers who shop homes sitting past the 27.5-day contract mark may find motivated sellers.
SFR Sales by Price Range
| Price Range | Sales | % of Total |
|---|---|---|
| Over $1M | 60 | 16.8% |
| $750K-$1M | 74 | 20.7% |
| $600K-$750K | 77 | 21.6% |
| $500K-$600K | 65 | 18.2% |
| $400K-$500K | 71 | 19.9% |
| $300K-$400K | 7 | 2.0% |
| Under $300K | 3 | 0.8% |
Condos & Townhomes
A Standout Month for Condos and Townhomes
Condos and townhomes were the surprise winners this month. The median sale price jumped to $370,000, a striking 14.6% gain over last month and 10.4% above last year. Furthermore, closed sales rose to 76 units, up 2.7% from the prior month — a sharp contrast to the drop seen in single family homes. Total sales volume came in at $28,043,754, with a median price per square foot of $298.51. In short, the lower-priced side of the market is pulling in buyers.
Timing, New Listings, and Inventory
Condos sold in a median of 54.5 days, slightly faster than single family homes. More notably, that is 40.8% quicker than a year ago, which shows demand has picked up in a big way. Offers came in fast too, with a median of just 24.0 days to contract. Meanwhile, 90 new listings arrived, outpacing the 76 closed sales. Active listings sat at 241, with 75 pending, putting months of supply at 3.2. Therefore, the condo market sits right at the edge of balanced territory, with months of supply down 12.9% from last year.
Price Cuts and Cash Buyers
Price cuts were a bit less common here than in the single family market. Specifically, 35.5% of condo sales had a reduction, compared to 39.5% for houses. However, when cuts happened, they were deeper on a percentage basis — a median of 5.3%, or $20,000. Also worth noting, condos sold at 96.6% of original list price, a bit lower than houses. Beyond that, cash was king in this segment, with 36.8% of sales closing without a loan. That points to strong investor and downsizer interest.
Takeaways for Condo Buyers and Sellers
For sellers, this is a good moment to list. Rising prices, faster sales, and less supply than last year all work in their favor. For buyers, the window to find a deal may be narrowing, yet the 3.2 months of supply still offers more breathing room than the single family side. On top of that, buyers who can pay cash hold a real edge, since more than a third of deals close that way. While single family sales slowed, condo sales held steady — and that gap is worth watching.
Condo/Townhome Sales by Price Range
| Price Range | Sales | % of Total |
|---|---|---|
| Over $1M | 0 | 0.0% |
| $750K-$1M | 0 | 0.0% |
| $600K-$750K | 5 | 6.6% |
| $500K-$600K | 7 | 9.2% |
| $400K-$500K | 21 | 27.6% |
| $300K-$400K | 18 | 23.7% |
| Under $300K | 25 | 32.9% |
Financing Breakdown (All Properties)
| Loan Type | Sales | % of Total |
|---|---|---|
| Conventional | 221 | 51.0% |
| Cash | 129 | 29.8% |
| FHA | 48 | 11.1% |
| VA | 26 | 6.0% |
| Other | 4 | 0.9% |
| Private | 4 | 0.9% |
| Unknown | 1 | 0.2% |
Sales by City
| City | Sales | Median Price |
|---|---|---|
| Reno | 317 | $600,000 |
| Sparks | 116 | $592,500 |
Reno/Sparks Real Estate Market Outlook – October 2026
Overall, Reno/Sparks remains a seller’s market, with 2.6 months of supply area-wide and 1,107 active listings. Still, the market is sending mixed signals: prices are up 7.9% from last year, yet sales are down and 38.8% of sellers had to cut their price. Looking ahead, buyers should watch inventory closely, since rising supply could open more room to negotiate. Sellers, meanwhile, should price sharply from the start, and investors may want to look at the fast-moving condo segment where cash deals hit 36.8%. That said, the latest national Freddie Mac weekly rate of 7.18% is a factor for buyers signing new contracts now. In short, this is a market that rewards preparation — those who know the numbers will come out ahead.
Thanks for reading our Reno/Sparks real estate market report for October 2026. We publish these updates monthly.
Have Questions About the Reno/Sparks Market?
Whether you are considering buying, selling, or simply trying to understand how current market conditions affect your home’s value, local data matters.
For a data-driven look at your specific neighborhood or property type, contact Guy Johnson, REALTOR® with Keller Williams Group One, Inc.
Guy Johnson, REALTOR®
Keller Williams Group One, Inc.
NV Lic. # S.75262.LLC
Phone: (775) 722-4011
Email: guyjohnson@kw.com
Get the monthly market reports by email
Reno/Sparks, Carson City, and Incline Village numbers, sent to your inbox when each new report is out. I'll only email you when I publish something new, and you can unsubscribe anytime. — Guy